3 Things I Learned Charting Apartment Building & Commercial Real Estate Market Cycles

Seattle’s Strange Trip Through the Apartment Building Investment Cycle Part II

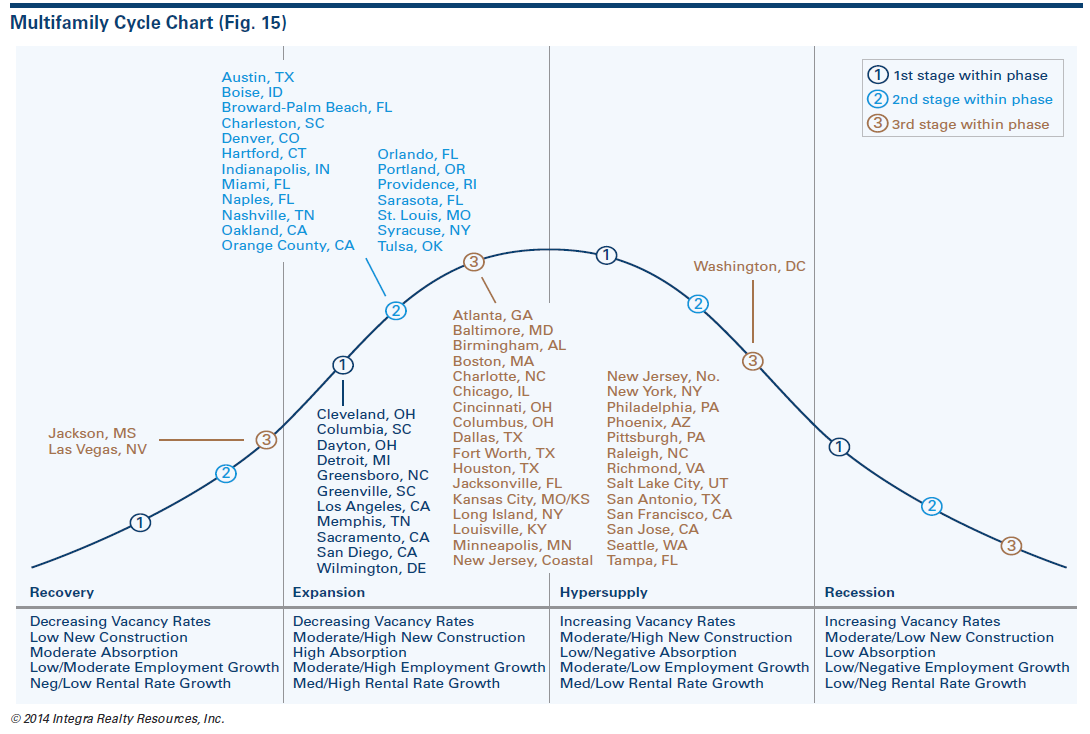
In part I we saw that some of the most widely followed market cycle research can’t be relied on without question. If knowing where we are in the market cycle is the most important thing (and not everyone agrees, see the comments from one of my private equity guys about that under part I here) then the best solution is probably to chart the cycles for the markets we’re investing in ourselves. If you’re in multiple CRE sectors in a lot of markets hopefully you have someone on your team or can hire a consultant (like Ashworth) to chart those cycles.

SEA occupancy v cycle position WTH
Click on images for full size.

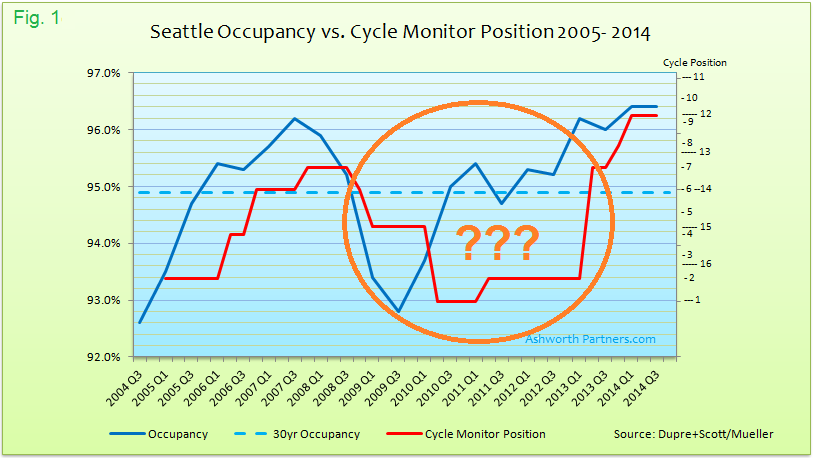
Building our own CRE market cycle chart

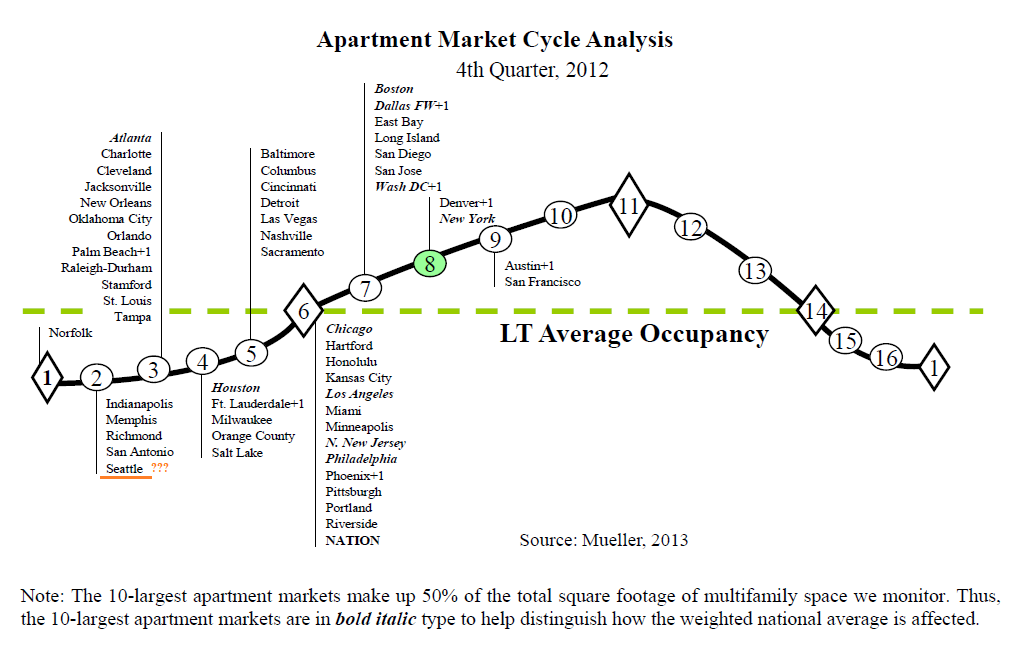
To track a cycle for one market and sector we only need to answer five questions according to Professor Mueller’s methodology: Market occupancy, the 30 year Long Term Average (LTA) occupancy, rent growth, inflation and new unit construction. Later we’ll look at whether we can Continue reading 3 Things I Learned Charting Apartment Building & Commercial Real Estate Market Cycles

Widely Followed Apartment Market Cycle Research Misses Widely

The Strange Tale of the Seattle Apartment Building Investment Cycle and Maybe Yours Too.

Back in 2012 it appeared that Seattle’s movement through the real estate cycle was stalling out. Not the actual market by any stretch of the imagination but instead where it was placed on the apartment market cycle charts in the Cycle Monitor report from Dividend Capital Research. These quarterly reports on the real estate market cycles for the five main Commercial Real Estate (CRE) sectors in more than fifty markets around the US were widely followed but something was wrong.

Seattle apartment occupancy vs. Cycle Monitor Market Position 2005 - 2014
Click on images for full size.

Why this up to date market data is vitally important to your investment success:

You can fix a property but not a market cycle. Knowing where a market is in its cycle is critical for investors seeking to buy low and sell high. If signals are a year or more behind, prime opportunities will be missed to Continue reading Widely Followed Apartment Market Cycle Research Misses Widely

Do You Know Where Your Apartment Market Is Right Now?

…In its investment cycle?

Well Integra Realty Resources (IRR) is just out with their 2015 Viewpoint Report covering where they think things are and where they might be headed in the five major sectors of Commercial Real Estate (CRE); office, industrial, retail, multifamily and hospitality… as well as a bonus piece on self-storage. IRR is one of the largest independent commercial real estate appraisal firms in the U.S and this is their 25th annual IRR Viewpoint in the fifteen year history of the company according to their chairman in his introduction. Not sure on the math there but I do have their reports going back to 2002.

In the report they cover cap rates, going-in cap rates, discount rates, yields, reversion rates and much more but the first thing I look at is their market cycle chart for the multifamily sector:

IRR Apartment Building Investment Cycle Chart Integra Realty Resources
Click on image for full size. Source: Integra Realty Resources

So IRR has an idea of where your apartment market is, provided your market is in one of the sixty plus places where they have an office. The big question is do you agree with their placement? It is very important to review the data and form your own idea on this because there are good reasons to doubt Continue reading Do You Know Where Your Apartment Market Is Right Now?

Job growth vs. revenue growth chart of top apartment building investment markets in the US- updated.

Back in February we posted an Axiometrics chart plotting the revenue growth vs. job growth in leading apartment investment markets in the US. They were out last week with an updated chart but not just in the way we might think since the numbers are Axiometrics’ 2013 forecasts for revenue and job growth updated through May this year. To me the real ‘update’ is that they reversed the axises on the chart and I think it makes more sense laid out this way:

Job Growth and Rent Growth for Apartment Building Investment
Click for full size image. Source: Axiometrics

Before I get sidetracked onto a long discussion on the importance of understanding just Continue reading Job growth vs. revenue growth chart of top apartment building investment markets in the US- updated.

The ‘Twin Peaks’ of Seattle Apartment Building Investment Plus MPF Research says rent growth holding strong there.

Friday twofer on Seattle. First is Dupre+Scott’s  entertaining and enlightening video on apartment building construction and property sales:

Mike has two nice charts showing apartment development numbers back to 1988 and sales volume back to 1981. Note that on the sales volume chart 2013 numbers are Continue reading The ‘Twin Peaks’ of Seattle Apartment Building Investment Plus MPF Research says rent growth holding strong there.

Latest Commercial RE and Apartment Building Investment Cycle Charts Posted by Glenn Mueller PhD.

…. “Only six markets advanced their position on the [Dividend Capital Apartment Market] cycle chart.” Once again with the notable exception of Seattle who has left in the basement of the cycle despite overwhelming evidence that it has moved well up in the cycle by his own definition. See my post from last quarter detailing the definitions and why Seattle’s apartment building investment cycle location according to Dr. Mueller is incorrect here. For other cities have a look and let me know if your markets are accurately placed:

Apartment Building Investmet Cycle Chart Q4 2012

Is it a Seattle thing? Is he the Brent Musburger of commercial real estate? Continue reading Latest Commercial RE and Apartment Building Investment Cycle Charts Posted by Glenn Mueller PhD.

The Recession Probability Chart, A New Coincident Indicator?

Quick link to a very interesting chart Bill McBride put up over at Calculated Risk:

Chance of Recession?
Source: FRED. Note: We added the red and green lines (at 80 and 20 on chart) to highlight points made in the article.


The chart is from the St. Louis Fed’s Fred database which I’ve highlighted and you can find the original here.  According to U of O Professor Jeremy Piger: “Historically, three consecutive Continue reading The Recession Probability Chart, A New Coincident Indicator?

Apartment Building Permits Rise to Long-term Average while Vacancy Index Remains Low

In their latest apartment building permitting report Axiometrics says: “permitting increased 44.3% or 84,308 units from the January 2012 figure of 274,640 units.” This is very near the long term average of 280,000 units, see the chart:

Apartment Building Investment New Construction Permits

Note that single family permits are still Continue reading Apartment Building Permits Rise to Long-term Average while Vacancy Index Remains Low

The Federal Reserve and Beer Goggles plus what Financial Repression means for Apartment Building Investments

James Montier, who works at the intersection of value investing and behavioral investing (Author of ‘The Little Book of Behavioral Investing’ http://amzn.to/X9Olzc on Amazon among others) has a great quote in his latest white paper published by GMO Global Investment Management entitled “The 13th Labour of Hercules:Capital Preservation in the Age of Financial Repression” Note that you may have to register at the site (free).

His paper discusses the effects of financial repression on portfolio stock and bond allocations and by implication the effects on real estate and particularly  apartment building investments. Financial repression is the term used to describe central bank’s strategies for forcing interest rates to zero or negative to spur investment and spending at the expense of saving. Take it away James:

William McChesney Martin was the longest-serving Federal Reserve Governor of all time. He is probably most famous for his observation that the central bank’s role was to “take away the punch bowl just when the party is getting started.” In contrast, Bernanke’s Fed is acting like teenage boys on prom night: spiking the punch, handing out free drinks, hoping to get lucky, and encouraging everyone to view the market through beer goggles. [Emphasis mine]

The paper goes into depth on the effects of financial repression on investments, which grow the longer the repression lasts, up to twenty years. Does the phrase: “… for an extended period” ring a bell? How about QE1, QE2, QE3, and now QE-infinity?

Financial Repression and Apartment Building Investment
Source: James Montier, GMO


Apartment buildings are the real estate equivalent of Continue reading The Federal Reserve and Beer Goggles plus what Financial Repression means for Apartment Building Investments

Apartment Building Investment Cycle Analysis via Dividend Capital. Can this be right?

Dividend Capital’s Q3 Market Cycle Monitor Report is out and naturally I looked at the apartment building investment cycle chart first. Specifically these days I’m looking to see where the author, Glenn R. Mueller Ph.D. has placed the Seattle market in the cycle.

US Q3 apartment building investment cycle analysis from Dividend Capital

In this latest report you can see that it is listed at position 2 with only Norfolk listed lower at position 1. What does position 2 signify? According to the good Doctor, position 2 lies in the Phase 1 – Recovery Quadrant defined as having “No New Construction” and position 2 specifically having “Negative Rental Growth”. But how can this be? Continue reading Apartment Building Investment Cycle Analysis via Dividend Capital. Can this be right?