Fed Chair Yellen- Maybe we are turning Japanese

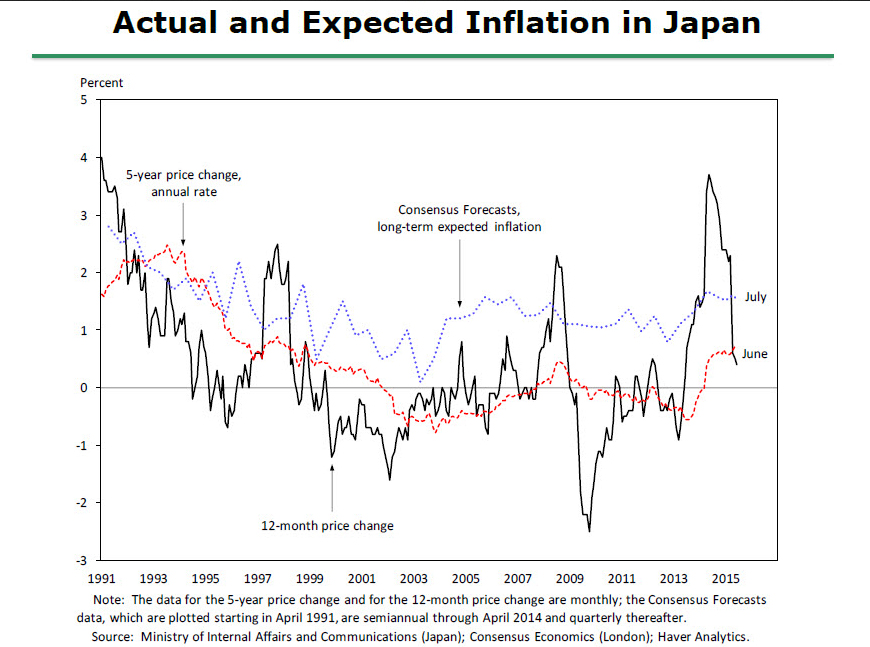
Actual and Expected Inflation in Japan
“Here, Japan’s recent history may be instructive: As shown in figure 9, survey measures of longer-term expected inflation in that country remained positive and stable even as that country experienced many years of persistent, mild deflation.” – Janet Yellen Sep. 24, 2015

Was talking about this just last week (again):

As a value guy like you it’s hard to figure out how buying something in the sixes on cap rate works out to be a good deal. But what if the Fed is trapped at the Zero Lower Bound and we are turning Japanese? Their ‘Lost Decade’ is now old enough to graduate with a Master’s degree and we’re following the exact same playbook. I offer last week’s Fed decision as exhibit #1. They would dearly love to raise rates just to prove they can but there’s just thin ice between us and

Continue reading Fed Chair Yellen- Maybe we are turning Japanese

Are Interest Rates Caught in a Catch 22?

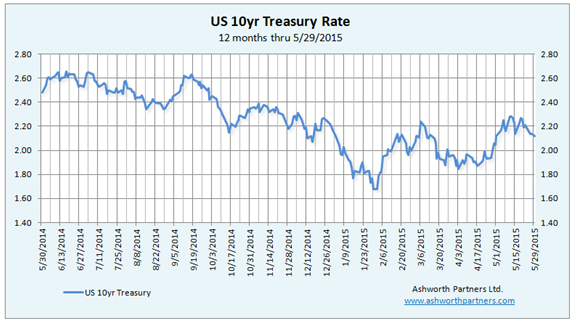
Are interest rates caught in a Catch-22? What if the Fed is waiting to raise rates until the economy is growing stronger but the economy won’t grow stronger until rates go up?

10 year Treasury Rates June 2014 - May 2015

For three years everyone has ‘known’ that interest rates were going up but other than during the Taper Tantrum of June 2013 which affected loan rates more than Treasuries, the T10 only moved up to the 2.75% area which was just picking itself off the floor of 1.66 where it got down to in May that year.

The Fed would like to raise rates, if for no other reason than to prove they aren’t turning Japanese by leaving rates low for two and a half ‘Lost Decades’. They’d also like to have room to lower them again if the economy dips back into recession (Note Q1 GDP was just revised down to -.7% that’s Continue reading Are Interest Rates Caught in a Catch 22?

10yr #Multifamily Investment Loan Rate Comes Back to Life, Rises 7.9 Basis Points

The 10 year apartment building investment loan rate we track moved up to 4.454% from 4.375% yesterday after flatlining at the old rate since the middle of January:

10 year treasury vs. apartment building investment loan rate May 2015

Even so it is still below what we used to think of as the 4.5% floor for this rate. Meanwhile the ULI rate has been tracking the 10yr Treasury, rising from 3.37% April 20th to 3.76% yesterday, a climb of almost 40 basis points.

Is this the beginning of the long anticipated (The 3rd or 4th year in a row that everyone’s known rates were going to rise) rate hikes? It makes sense that the Fed would like them to get up off the floor if for no other reason that they would have room to lower them again when they needed to. But is now the time to do that when China, Europe and the rest of the world are slowing down?

While the US economy has been Continue reading 10yr #Multifamily Investment Loan Rate Comes Back to Life, Rises 7.9 Basis Points

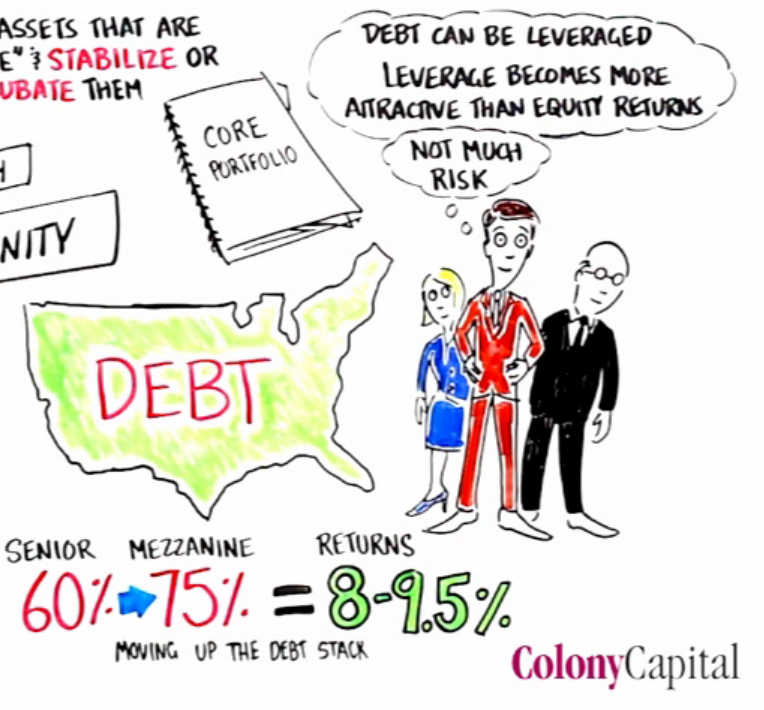
Opportunities For Real Estate Investment Today by Tom Barrack of Colony Capital

Tom Barrack over at Colony Capital put up a nice presentation of where he sees the opportunities for real estate investment in the current market. While Colony is geared to serving their large institutional investors, those of us operating on a smaller scale can benefit from Tom’s insights as well.

My Exec Sum of the opportunities he sees that I think will impact smaller investors in North America (and my comments in parentheses):

  • Commercial and residential real estate are great investments today because equities and debt are mispriced and the economy is regaining its feet. (There will be competition however).
  • Distressed debt in the US is diminishing but they are continuing to resolve non-performing assets (which can create deals for long term holders as these turned around assets come back to the market).
  • Single family residential for rent housing is stabilizing and becoming a institutional asset class (which can provide exits for those who have built portfolios of these properties).
  • Mezzanine debt and what he calls ‘stretched senior debt’ is becoming more available for value add & opportunistic deals because institutional investors such as pension funds need the extra yield (it will be easier to finance turnaround commercial properties at higher LTVs).
Investment opportunities for commercial real estate investors in North America
Source: Tom Barrack at Colony Capital

5 Key Trends from the ULI Report for Apartment Building Investors and Commercial Real Estate Pros

The Urban Land Institute/PriceWaterhouseCoopers annual report on Emerging Trends for Real Estate 2014 was released last week and apartment building investors and commercial real estate pros have some good things to look forward to next year. Note that this post refers to the Americas version of the report with separate sections on Canadian and Latin American markets but they also publish Asia-Pacific and European editions as well. This is the 35th edition of the report is it’s based on individual  interviews or surveys from more than 1,000 investors, fund managers, developers, property companies, lenders, brokers, advisers, and consultants.

Here are the 5 key trends we should all be aware of with my comments:

  • Survey participants continue to rank private direct real estate investment as having the best investment prospects. Pretty expected from this group but the National Council of Real Estate Investment Fiduciaries (NCREIF) recently released its property performance index for the third quarter of 2013 and on a trailing 12-month basis, the index’s return was 11.0 percent, split about 50/50 between income and appreciation. A pretty nice return compared to fixed income rates and a much safer looking bet than buying equities at their all time highs.
  • Dependence on cap rate compression to drive value is being replaced by an emphasis on asset management. Especially in the 24 hour gateway markets apartment building cap rates are about as low as they can get (well until you look at Vancouver BC) so property performance has to come from actually making the property perform. You also have the problem of what to do with your proceeds if you do sell, as you would be reinvesting right back into the same cap rate market that you sold in… unless you changed to a higher cap rate sector, suburban strip centers anyone?
  • Opportunities to develop property are finally appearing in sectors other than multifamily. CBRE Econometrics had a piece out last week showing that large (> 350k sf) warehouse properties are being snapped up as fast as they’re being built. Maybe developers who moved over to doing apartments the last few years will move back to their home sectors and ease off on the new supply of multifamily units.
  • Value-added investment ranked highest in terms of investment strategy; distressed properties and distressed debt ranked last. We were licking our chops a few years ago waiting for RTC 2.0 fire sales to begin and while we were able take down some bank owned inventory, the anticipated tsunami of defaults on commercial loans never materialized. At this point most everything has been extended and pretended into performing status or sold off and so it’s back to making money the old fashion way: Finding and/or creating value.
  • Both equity investors and lenders are widening their search for business to include secondary markets and niche property types. This will be a double edged sword for investors who are focused on those secondary and tertiary markets as debt financing will be more available but there will also be more competition from sophisticated outsiders with deep pockets. The key will be to make them your buyers so dig in, find the right properties and tie them up quickly.
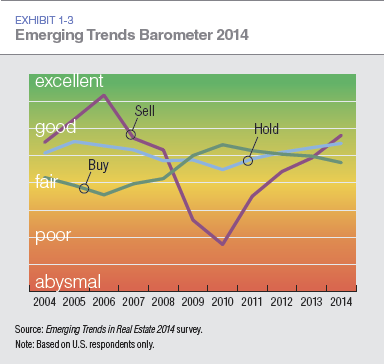
Emerging Trends Barometer for Apartment Building Investors and Commercial Real Estate 2014

As always with real estate, sectors and markets are so distinct from one another it’s almost pointless to generalize as the chart above attempts to do so next week I’ll dive into the apartment sector to see what gems they’ve unearthed. Meanwhile for the Continue reading 5 Key Trends from the ULI Report for Apartment Building Investors and Commercial Real Estate Pros
Don’t worry, be happy. US recession chances ‘smoothed’ away.

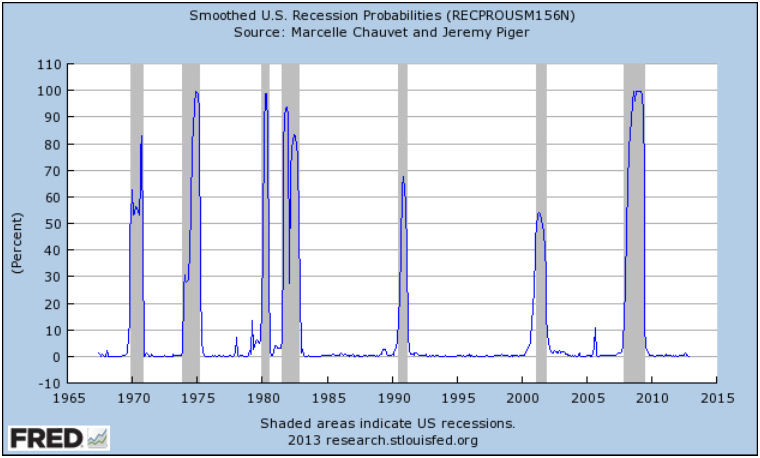
Three weeks ago we posted an update on the probability of recession that had jumped up into the warning zone: Update on Recession Probability: Rough Seas Ahead? The chart from the St. Louis Fed’s FRED data looked like this:

US recession warning from St. Louis Fed

Only twice in the last forty five years has the level gotten this high without a recession following soon after. The chart is usually updated only once a month but I check it every week, especially since it had risen. When I checked this week I got quite a shock because the high levels I had seen earlier had disappeared:

Chances of US recession August 2013

WT…? It turns out that the ‘Smoothed’ in the chart title: “Smoothed U.S. Recession Probabilities (RECPROUSM156N)” means that the data is subject to change based on Continue reading Don’t worry, be happy. US recession chances ‘smoothed’ away.

Update on Recession Probability: Rough Seas Ahead?

Back in March I posted a FRED chart that Bill McBride over at Calculated Risk shared tracking a set of data that pretty reliably coincides with recessions. Even better is that in almost fifty years of data there have been only two false positives which brings us to a very interesting point. First, here’s the chart as it appeared when I posted back in March:

FRED Recession Probabilities March 2013
Looks like pretty smooth sailing since 2010

Next let’s look in more detail at those false positives:

FRED Recession Probabilities March Detail
FRED Recession Probabilities March 2013

This is what I like about this data series: Even if we set the bar as low as 5%, there have only been two instances Continue reading Update on Recession Probability: Rough Seas Ahead?

Local Apartment Building Investment Research Reports For 37 US Cities Now Posted by Marcus & Millichap

Requires (free) registration: M&M Research

Here’s a peek at their Phoenix Charts:

Phoenix Apartment Building Rent Trends Q2 2013

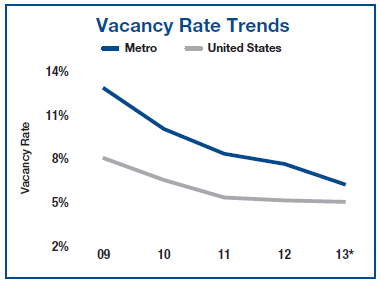
Phoenix Apartment Building Vacancy Q2 2013

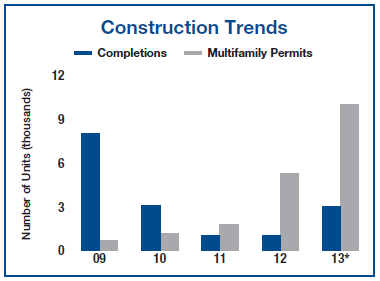
Phoenix Apartment Building Construction Q2 2013 Continue reading Local Apartment Building Investment Research Reports For 37 US Cities Now Posted by Marcus & Millichap

ULI Biz Barometer: Apartment building invesment sales vaulted last month, bouyed otherwise sagging #CRE sector.

The Urban Land Institute’s April Real Estate Business Barometer reports that apartment building investment sales were strong enough to pull the entire sector up from last month’s slump while CRE prices are at four year highs.  Condominium sales are also at a 5-1/2 year high with strongly increasing prices.

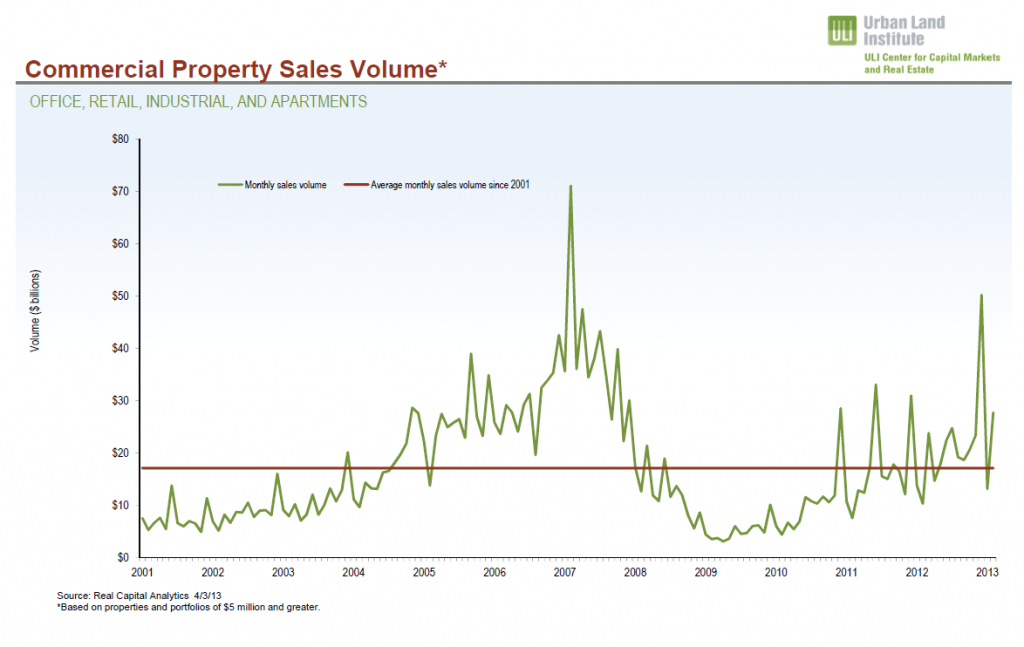
Apartment Building Investment and Commercial Property Sales April 2013

“Overall, 65 percent of the key Continue reading ULI Biz Barometer: Apartment building invesment sales vaulted last month, bouyed otherwise sagging #CRE sector.

CoreLogic Map: Almost 23 Million Zombie Homeowners Still Underwater.

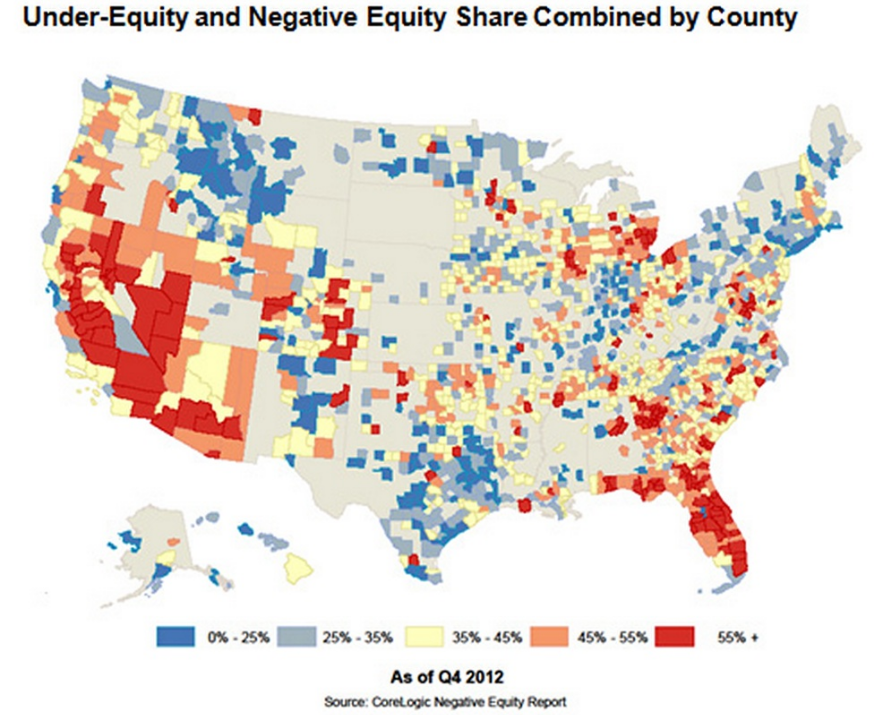
CoreLogic is out with their quarterly report and map of underwater homeowners. Their analysis is “showing approximately 200,000 more residential properties returned to a state of positive equity during the fourth quarter of 2012. This brings the total number of properties that moved from negative to positive equity in 2012 to 1.7 million and the number of mortgaged residential properties with equity to 38.1 million. The analysis also shows that 10.4 million, or 21.5 percent of all residential properties with a mortgage, were still in negative equity at the end of the fourth quarter of 2012. This figure is down from 10.6 million* properties, or 22 percent, at the end of the third quarter of 2012.

Negative equity, often referred to as “underwater” or “upside down,” means that borrowers owe more on their mortgages than their homes are worth. Negative equity can occur because of a decline in value, an increase in mortgage debt or a combination of both.

CoreLogic Homeowner Negative Equity Map

Of the 38.1 million residential properties with positive equity, 11.3 million have less than 20 percent equity. Borrowers with less than 20 percent equity Continue reading CoreLogic Map: Almost 23 Million Zombie Homeowners Still Underwater.