Three weeks ago we posted an update on the probability of recession that had jumped up into the warning zone: Update on Recession Probability: Rough Seas Ahead? The chart from the St. Louis Fed’s FRED data looked like this:
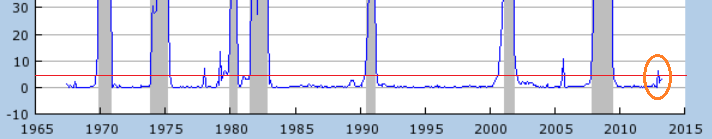
Only twice in the last forty five years has the level gotten this high without a recession following soon after. The chart is usually updated only once a month but I check it every week, especially since it had risen. When I checked this week I got quite a shock because the high levels I had seen earlier had disappeared:
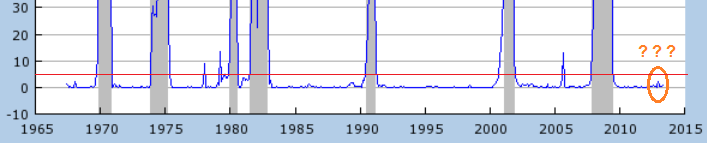
WT…? It turns out that the ‘Smoothed’ in the chart title: “Smoothed U.S. Recession Probabilities (RECPROUSM156N)” means that the data is subject to change based on “the most recent data available, and is thus potentially influenced by data that wasn’t available the first time a recession probability for a particular month was calculated. Smoothed recession probabilities will be revised over time as additional data becomes available, and as initially released data is revised. The effect of these revisions is to “smooth” away some of the spikes in the recession probabilities that occur in real time” (See #3 What is a smoothed recession probability? on the author’s FAC here) [Bold emphasis ours].
‘Smoothing’ does make the chart look nicer and I suppose if a recession did start the chart could be ‘smoothed’ higher as well but where does that leave us as CRE and apartment building investors? The main facts on the ground remain the same, most indicators outside of the stock market are wavering at stall speed and reading what Bernanke actually said about tapering instead of trader’s panicked interpretation of what they thought they heard means that the Fed will continue to err on the easy money, QE infinity side until unemployment comes down…. unless they can figure a way to unwind their trades without calling it ‘tapering.’ But that’s for another post.
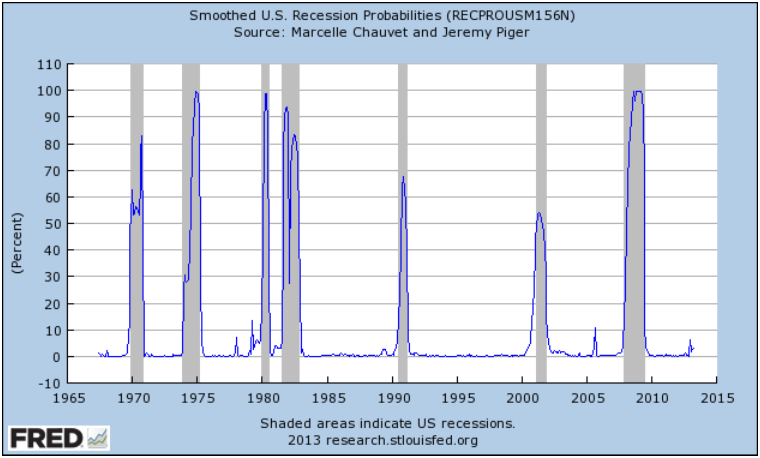
For reference below are the full Fed charts, first the July 2013 edition:
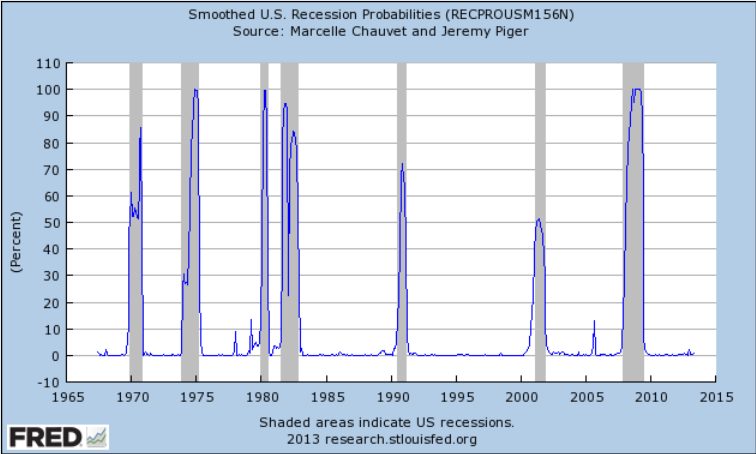
And the August edition:
How do you see the economy going forward and how will you adjust your strategy to fit?