Dealizer Version 5.5 Now Available
Thanks to great input from our Early Adopters, users and a lot of hard work by the development team we’ve releasing a new version of The Dealizer. V5.5 has many features that will help investors and real estate pros be more efficient, more effective and more profitable. Click on the links below to explore V5.5’s expanded capabilities:
- Printable/Sharable Reports
- Loan Fees Calculated
- More detail on Refinance
- More Measures of Performance
- Help Tab
- Plus Even More
As real estate investors and consultants, we look at hundreds of deals and our biggest challenge is to focus just on the properties that have real potential. In our search for a tool to quickly separate the diamonds from the duds when looking at properties, we couldn’t find anything that would quickly answer the question: Is this a potential deal or not?
After wrestling with most of the commercially available real estate products including some costing thousands of dollars and still requiring too much time to get an answer, we developed a simple tool to do just that. Now we are sharing it so that you too can focus on the diamonds and not the duds.
We use the Dealizer on every property we look at and so this tool gets daily use. While it’s called version 5.5 it’s really at least the 30th iteration because we’ve been using it for almost 10 years, honing and refining it to give us the most useful numbers and best results.
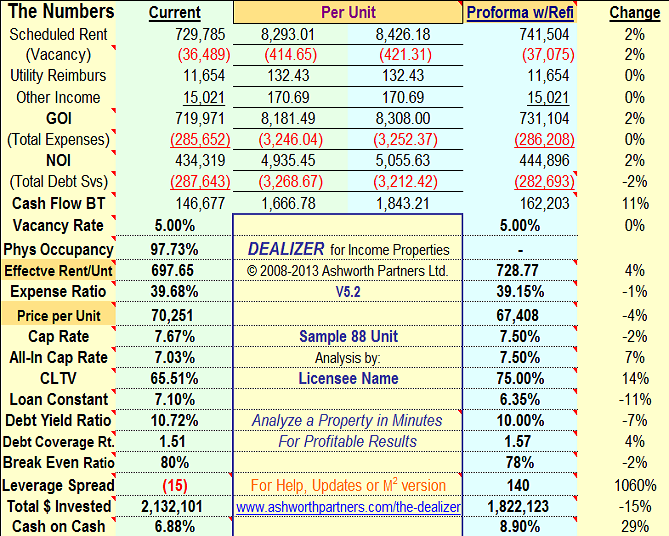
The Dealizer analysis tool is designed to quickly determine whether a real estate project is worthy of further investigation. In just one page (the dashboard) it will display the measures needed to decide whether to pursue the deal or not. With a minimum of data entry it will generate:
Click for full size image.
-
-
The Dealizer will break these numbers out by percent of Gross Operating Income, per unit and per square foot and allow you to compare Current to Proforma numbers.
-
With the Dealizer you can compare different financing alternatives and different Debt Coverage Ratios.
-
You can test the values at different Cap Rates and determine the value-add of different turnaround or repositioning strategies.
-
The Dealizer is built for income properties like apartments, self-storage as well as office, retail and industrial properties.
“Within minutes I can decide if I’m going to “Pass or Play” for many deals with the Dealizer. Using an advanced tool like this has been simple, easy and best of all I’m sure not to overlook anything critical.” – Patrick Gergen, CEO, American Multifamily Group
“The Dealizer quickly develops the numbers I need to make a solid pass/fail decision without relying on hazy back of the envelope estimates. It does just that with a minimum of data entry, no fluff, no filler, nothing but the numbers I need. The Dealizer is a tool that grows its ROI every time I use it.” – Dan Travers, CEO, Recraft LLC
New Features in Version 5 of The Dealizer
3 New Reports
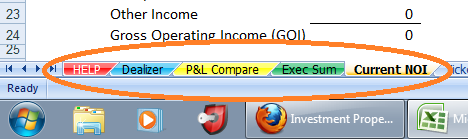
New in Version 5 are three reports, one to share with sellers and their brokers and two for lenders, partners and/or investors. They are each on their own separate tab so that you can find them quickly.
The Current NOI report is something we were creating by hand on almost every deal to show sellers what their actual NOI would be if they were purchasing their own property today, just as we are interested in doing. This report uses the current income and expense information you’ve entered on the Dealizer tab to develop what’s called an investable or financeable NOI (Net Operating Income). It’s often said that a property is worth what a bank will lend on it and the Current NOI report can be used to show exactly how your lender will look at the property to determine how much they will lend on it, and therefore what you can pay for it. To do this enter the vacancy rate, expenses and reserves that your lender uses in their underwriting.
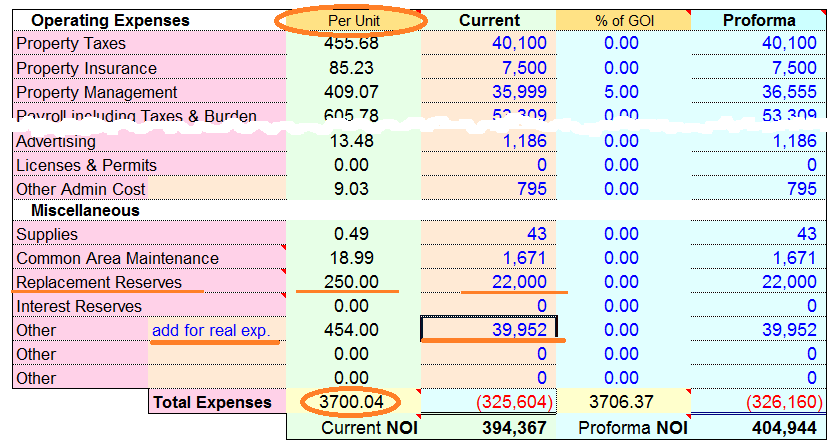
Click for full size image. For example, your lender underwrites $3,700.00 per unit annual expenses and requires an annual replacement reserve of $250.00 per unit. Entering that information on the Dealizer (see above) will produce the financeable NOI which you can show the buyer with the Current NOI report:
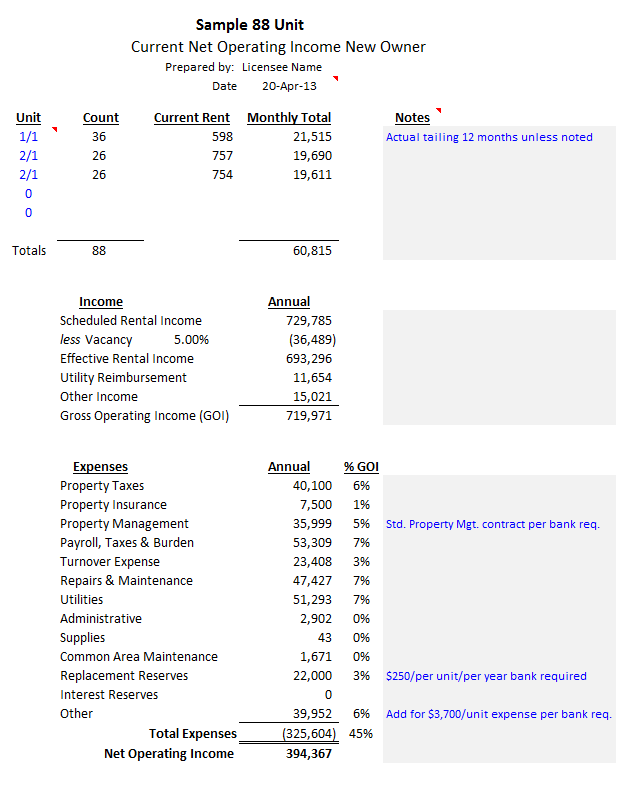
Click for full size image. On the Current NOI report tab you can enter comments in the gray boxes to provide factual backup to the numbers on the report. With the investable NOI strongly established negotiations can be focused on the correct market cap rate to apply to generate the purchase price. Note that the red triangles indicating in-cell notes do not appear when the report is printed and monochrome printing can be selected to change the blue comments to black for uniformity.
The P&L Compare tab has a new report that displays the property income, vacancy, expenses, net operating income, debt service and cash flow. The report can be customized to break out the numbers by percent of Gross Operating Income, Per Unit or Per Square Foot. The report also shows the percent change between the current and the proforma to highlight the benefits of your investment plan for the property. For a presentation quality report showing the economic performance of the property the P&L Compare report will show all the numbers down to the bottom line:
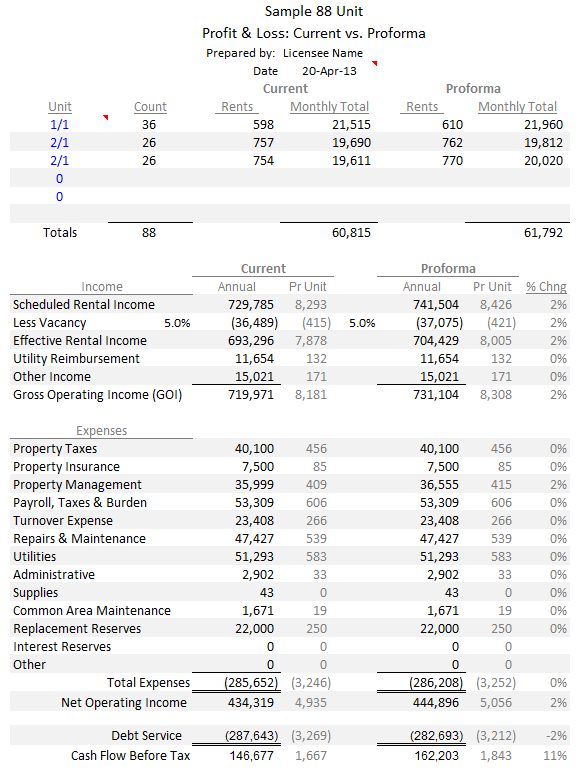
Click for full size image. On both the Current NOI and P&L Compare reports you can change the unit descriptions and/or delete the zer0s. Note if you list more than six unit types (or units) using the expanded table on page three of the Dealizer the consolidation should be noted in the unit type.
The Exec Sum tab has the new Executive Summary report which displays ‘just the numbers and nothing but the numbers, mam’. On one page it shows the purchase, the financing, the value add, income and expenses and all the standard measures of income property performance needed to convince lenders and investors to come aboard your deal:
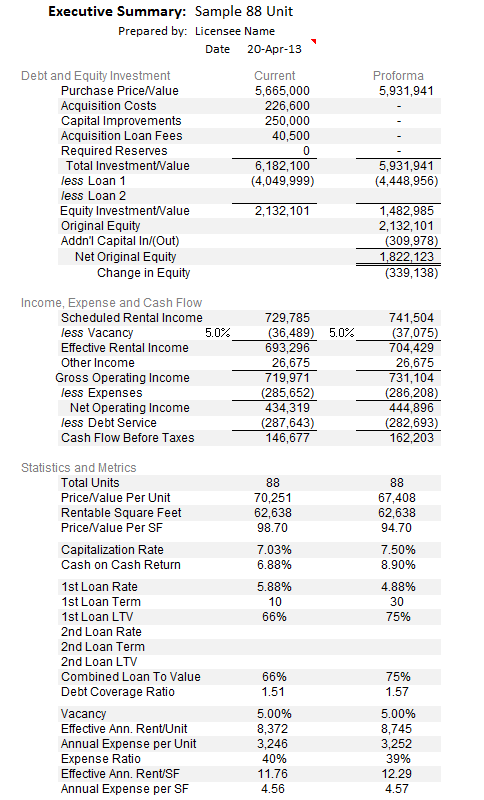
Click for full size image. The Exec Sum report can be configured to display the proforma numbers before or after refinancing, or no proforma numbers at all.
Loan Fees Calculated
V5 calculates loan fees based on the rates you enter and builds them into the Total Project cost and the refinancing. You can choose between paying them in cash or rolling them into the financing and the loan totals will be adjusted.
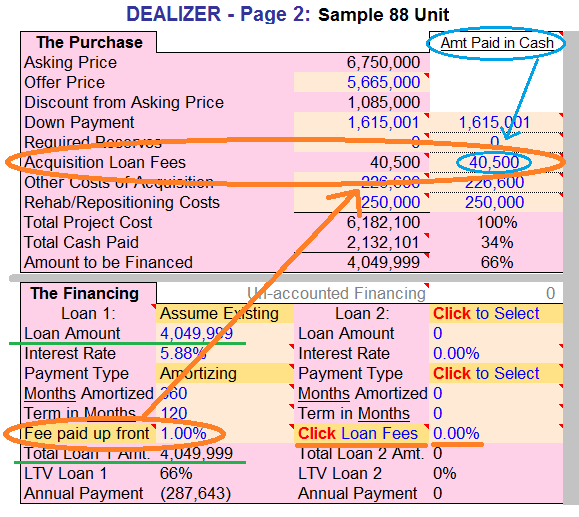
Click for full size image. In the sample above the loan fee of 1% is paid up front so it is calculated and added to The Purchase costs (Orange circles and arrow). Also underlined in orange are the Loan 2 Loan Fees to illustrate how they look before selections are made and percents are entered. When Click Loan Fees is clicked you will be able to select between Paid Up Front and Rolled Into Loan and enter the loan fee amount as a percent of the loan amount. Note that if the loan fees are rolled into the loan they will show up in the difference between the Loan Amount and the Total Loan Amt. (Green underlines). To keep the user in total control of the deal structure, the amount of the loan fees paid in cash is entered by the user in The Purchase section (Blue circles and arrow). This is to provide the option of fees for one loan being financed by another loan.
More Detail on Refinance
Refinancing options are now incorporated into The Financing and Numbers sections so you can model the property after a refinance and compare the investment with or without refinancing.
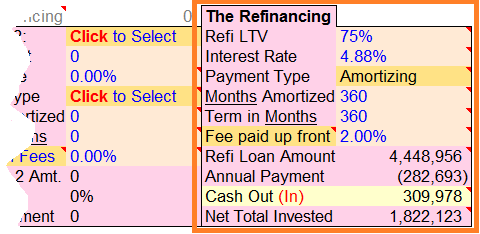
Click for full size image. Starting with the Loan To Value (Using Proforma Net Operating Income ÷ User entered Cap Rate = Proforma value) the details of the proposed refinance loan can be entered to develop the new loan amount, annual payment, cash out (Or in) and the net total invested (Orange square above). All this information flows to the dashboard in The Numbers section to be compared and contrasted with the current numbers and the proforma numbers without the original loan in place.

Click for full size image. More Measures of Performance
Dealizer V5 includes new measures of property and investment performance. On the property level physical occupancy, effective rent per unit and per square foot have been added. At the investment level we’ve added Debt Yield Ratio and Leverage Spread as well as Total Invested both on the current numbers and the proforma numbers with and without refinancing.
Help Tab
We’ve expanded the amount of Help under the To Start Click HERE button so much that it may not all display on smaller screens so we added a HELP tab at the bottom so you can easily click over there and scroll through the help items and then click back to the tab you were working on and continue working. We’ve also added many new in-cell tips, definitions and help. Any cell with a red triangle in the upper right corner has a note that will pop up when you roll over it with the cursor.
Plus Even More
We’ve simplified the color scheme to make it easier to find the numbers you want and need; all inputs are now bright blue and all outputs and black.
There are now four bright arrows pointing to four critical inputs and selections so that you don’t miss them.
All Yardsticks and other Click to Select cells have been highlighted in orange to make them easy to find.
-