Charging apartment building residents for water, sewer AND garbage- the growing trend.

In a study by Dupre+Scott they found a growing number of apartment building investors in the Puget Sound region are charging tenants for water, sewer and garbage which make up can make up a pretty large chunk of operating expenses:

apartment expense for tenant water sewer cost

Two-thirds of the properties we surveyed pass through water and sewer charges to residents, and 50% also pass through garbage costs. The average monthly water/sewer charge in the region ranges from $46 for studios to $70 for three-bedroom units. Adding garbage charges increases costs to $55 for studios and $90 for three bedroom units. Our March Apartment Expense Report found that utility charges paid by residents increased 50% between 2008 and 2012.

apartment building utility bills

Do you or have you considered charging for water and sewer via sub-metering, individual metering or a RUBS system? how about garbage? Continue reading Charging apartment building residents for water, sewer AND garbage- the growing trend.

CBRE Research: Since 2010 population shifting towards urban but apartment building construction is outpacing growth in

… A number of major metros

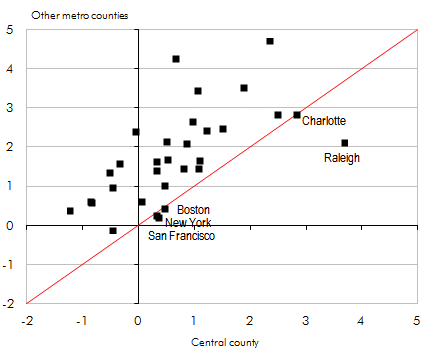
CBRE Econometrics is out with a new report showing population growth trends in major US metros has shifted towards urban centers since 2010 but apartment building investors have been keeping pace (or exceeding it) with new construction.  Author Gleb Nechayev, Senior Managing Economist lays it out nicely in a series of charts:

First Population Growth Average Change 2000- 2010

Population Growth in major Apartment Markets 2000 t0 2010
source: CBRE Econometrics

Raleigh is the only metro with significant urban vs. suburban population growth. Note that one-county metros such as Continue reading CBRE Research: Since 2010 population shifting towards urban but apartment building construction is outpacing growth in

FHFA’s DeMarco re-affirms cutting Fannie and Freddie apartment building loan volume.

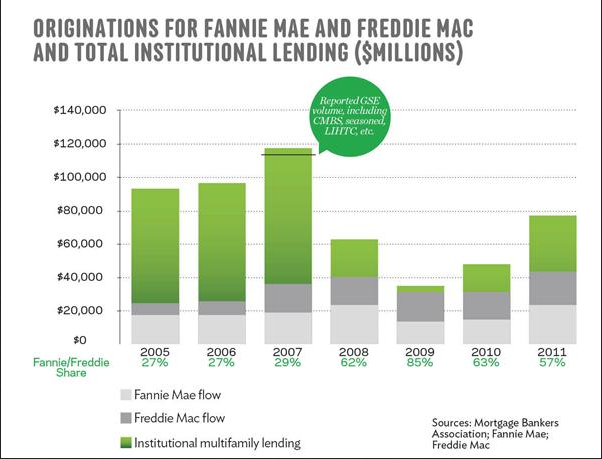
As reported by CoStar: “Given that the multifamily market’s reliance on the enterprises has moved to a more normal range, to move forward with the contract goal, we are setting a target of a 10% reduction in multifamily business new acquisitions from 2012 levels,” Edward DeMarco, acting director of the Federal Housing Finance Agency (FHFA) said. “We expect that this reduction will be achieved through some combination of increased pricing, more limited product offerings and tighter overall underwriting standards.”

Fannie and Freddie Apartment Building Loans as percent of multifamily originations
Source: www.multifamilyexecutive.com/

While 10 percent doesn’t sound like much, Fannie Mae and Freddie Mac combined to finance about $62.8 billion in multifamily deals last year, meaning about $6 billion in liquidity will Continue reading FHFA’s DeMarco re-affirms cutting Fannie and Freddie apartment building loan volume.

CoreLogic Map: Almost 23 Million Zombie Homeowners Still Underwater.

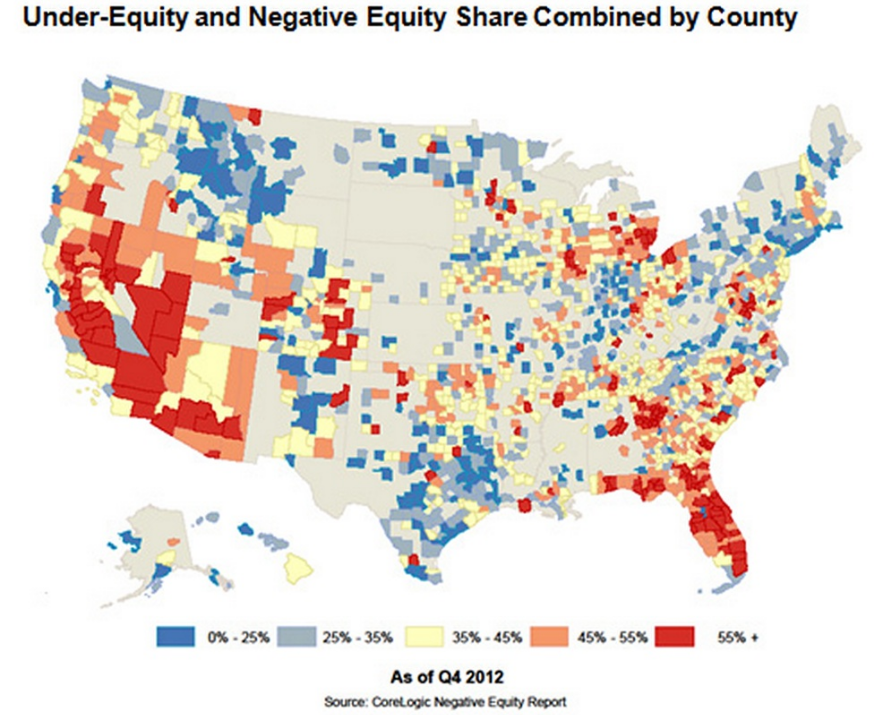
CoreLogic is out with their quarterly report and map of underwater homeowners. Their analysis is “showing approximately 200,000 more residential properties returned to a state of positive equity during the fourth quarter of 2012. This brings the total number of properties that moved from negative to positive equity in 2012 to 1.7 million and the number of mortgaged residential properties with equity to 38.1 million. The analysis also shows that 10.4 million, or 21.5 percent of all residential properties with a mortgage, were still in negative equity at the end of the fourth quarter of 2012. This figure is down from 10.6 million* properties, or 22 percent, at the end of the third quarter of 2012.

Negative equity, often referred to as “underwater” or “upside down,” means that borrowers owe more on their mortgages than their homes are worth. Negative equity can occur because of a decline in value, an increase in mortgage debt or a combination of both.

CoreLogic Homeowner Negative Equity Map

Of the 38.1 million residential properties with positive equity, 11.3 million have less than 20 percent equity. Borrowers with less than 20 percent equity Continue reading CoreLogic Map: Almost 23 Million Zombie Homeowners Still Underwater.

New Stats from HUD/Census apartment building finance survey

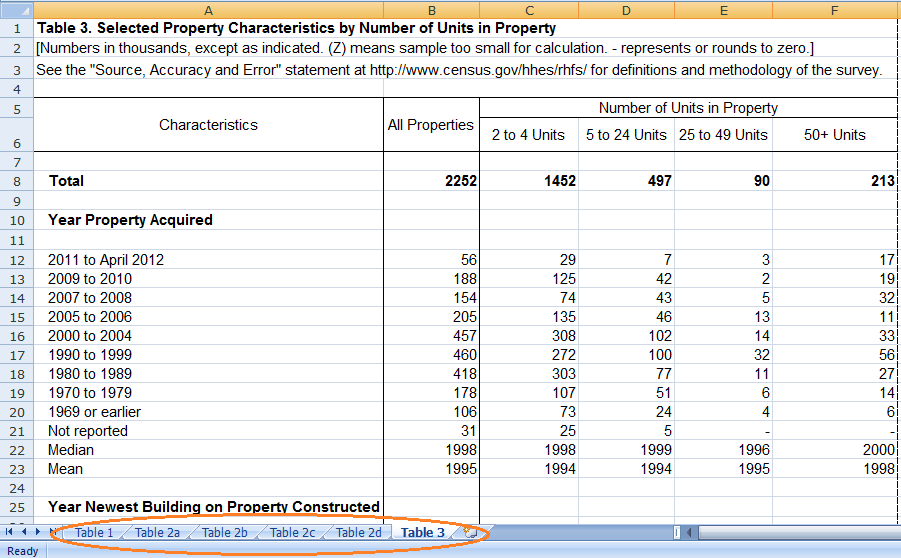
HUD and the Census Bureau released the latest version of the Rental Housing Finance Survey. The “Survey fills an important gap in our understanding of who owns multifamily rental housing – mostly individuals, not large companies — and how multifamily rental housing is financed, especially as the structure of finance is changing.  In light of recent changes in the availability of capital for rental housing, the Rental Housing Finance Survey also provides important insight about the financial health and stability of multifamily housing properties.” said Erika Poethig, HUD’s Deputy Assistant Secretary for Policy Development.

2012 Rental Housing Finance Survey

This is one table from the xls on the Census Bureau’s site here. Note the tabs on the bottom which have the data broken out by different types.

A few bullet points from HUD’s release linked at the top of the post:

Back To The Future: A Brief History of Apartment Building Design

Mike Scott of Dupre+Scott Apartment Advisors gives a tour through the last hundred years or so of apartment building design. Plus ça change….

In the accompanying article (here) Mike talks with builders and developers about current trends in apartment design and amenities. Interestingly many of these changes provide a competitive advantage to Continue reading Back To The Future: A Brief History of Apartment Building Design

Latest Commercial RE and Apartment Building Investment Cycle Charts Posted by Glenn Mueller PhD.

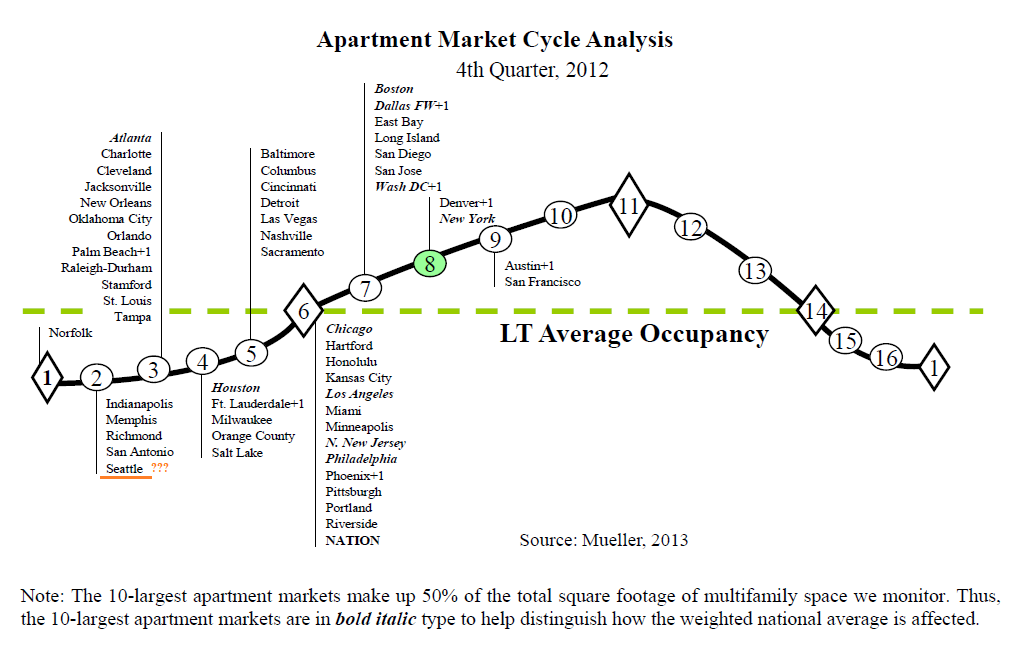
…. “Only six markets advanced their position on the [Dividend Capital Apartment Market] cycle chart.” Once again with the notable exception of Seattle who has left in the basement of the cycle despite overwhelming evidence that it has moved well up in the cycle by his own definition. See my post from last quarter detailing the definitions and why Seattle’s apartment building investment cycle location according to Dr. Mueller is incorrect here. For other cities have a look and let me know if your markets are accurately placed:

Apartment Building Investmet Cycle Chart Q4 2012

Is it a Seattle thing? Is he the Brent Musburger of commercial real estate? Continue reading Latest Commercial RE and Apartment Building Investment Cycle Charts Posted by Glenn Mueller PhD.

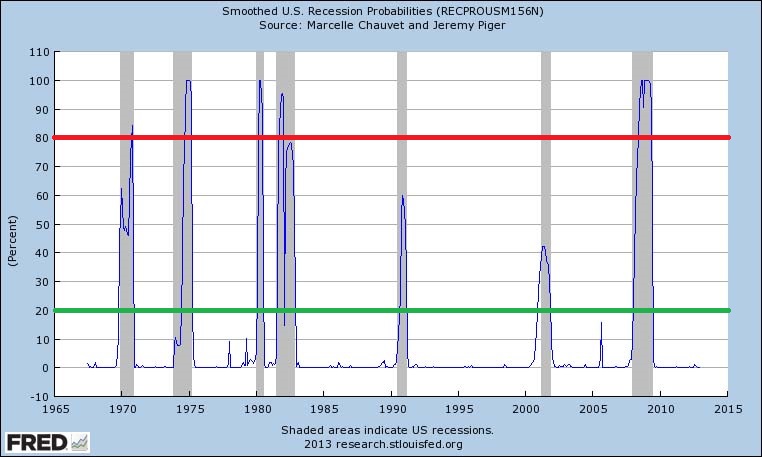
The Recession Probability Chart, A New Coincident Indicator?

Quick link to a very interesting chart Bill McBride put up over at Calculated Risk:

Chance of Recession?
Source: FRED. Note: We added the red and green lines (at 80 and 20 on chart) to highlight points made in the article.


The chart is from the St. Louis Fed’s Fred database which I’ve highlighted and you can find the original here.  According to U of O Professor Jeremy Piger: “Historically, three consecutive Continue reading The Recession Probability Chart, A New Coincident Indicator?

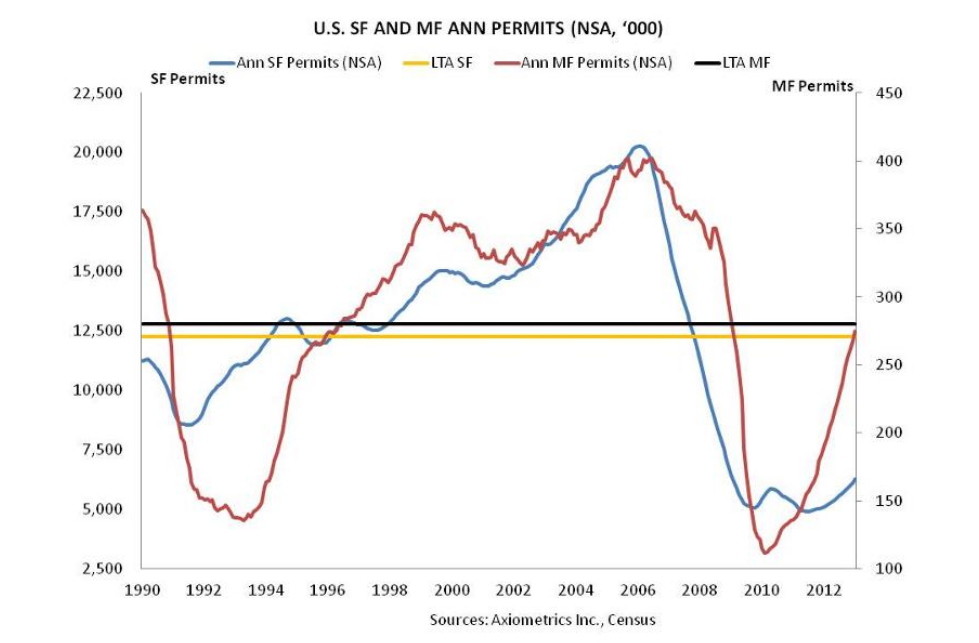
Apartment Building Permits Rise to Long-term Average while Vacancy Index Remains Low

In their latest apartment building permitting report Axiometrics says: “permitting increased 44.3% or 84,308 units from the January 2012 figure of 274,640 units.” This is very near the long term average of 280,000 units, see the chart:

Apartment Building Investment New Construction Permits

Note that single family permits are still Continue reading Apartment Building Permits Rise to Long-term Average while Vacancy Index Remains Low