Three weeks ago we posted an update on the probability of recession that had jumped up into the warning zone: Update on Recession Probability: Rough Seas Ahead? The chart from the St. Louis Fed’s FRED data looked like this:
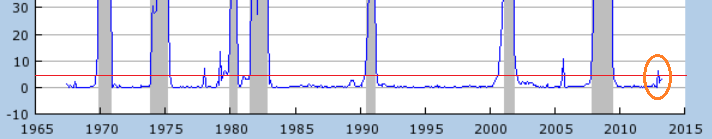
Only twice in the last forty five years has the level gotten this high without a recession following soon after. The chart is usually updated only once a month but I check it every week, especially since it had risen. When I checked this week I got quite a shock because the high levels I had seen earlier had disappeared:
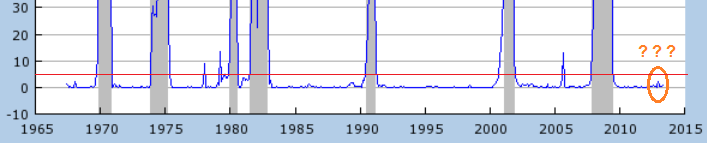
WT…? It turns out that the ‘Smoothed’ in the chart title: “Smoothed U.S. Recession Probabilities (RECPROUSM156N)” means that the data is subject to change based on Continue reading Don’t worry, be happy. US recession chances ‘smoothed’ away.
