Update on Recession Probability: Rough Seas Ahead?

Back in March I posted a FRED chart that Bill McBride over at Calculated Risk shared tracking a set of data that pretty reliably coincides with recessions. Even better is that in almost fifty years of data there have been only two false positives which brings us to a very interesting point. First, here’s the chart as it appeared when I posted back in March:
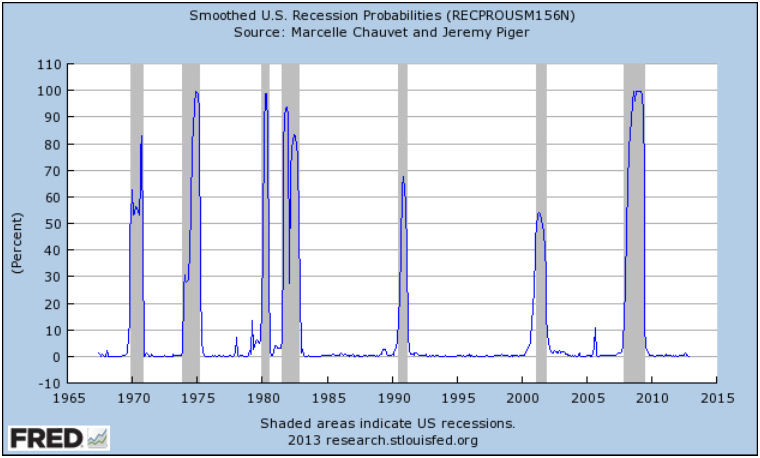
FRED Recession Probabilities March 2013
Looks like pretty smooth sailing since 2010

Next let’s look in more detail at those false positives:

FRED Recession Probabilities March Detail
FRED Recession Probabilities March 2013

This is what I like about this data series: Even if we set the bar as low as 5%, there have only been two instances Continue reading Update on Recession Probability: Rough Seas Ahead?
The Recession Probability Chart, A New Coincident Indicator?

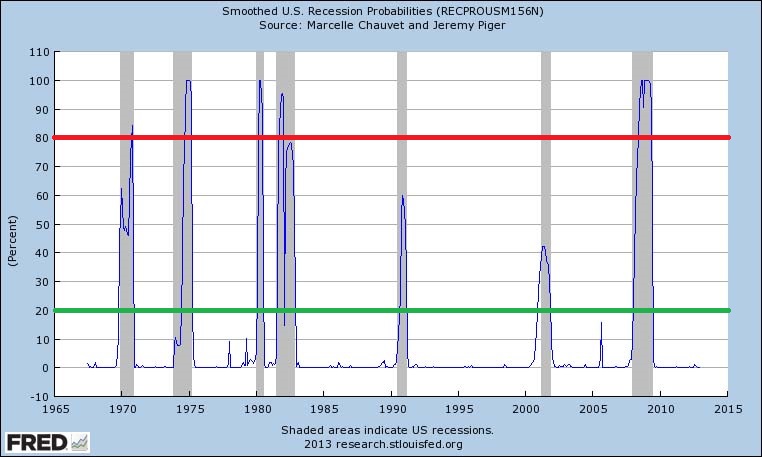
Quick link to a very interesting chart Bill McBride put up over at Calculated Risk:

Chance of Recession?
Source: FRED. Note: We added the red and green lines (at 80 and 20 on chart) to highlight points made in the article.


The chart is from the St. Louis Fed’s Fred database which I’ve highlighted and you can find the original here.  According to U of O Professor Jeremy Piger: “Historically, three consecutive Continue reading The Recession Probability Chart, A New Coincident Indicator?