10yr Treasury back in 2.6% range bringing apartment loan rates up. The spread also widened but remained below 2013 average.

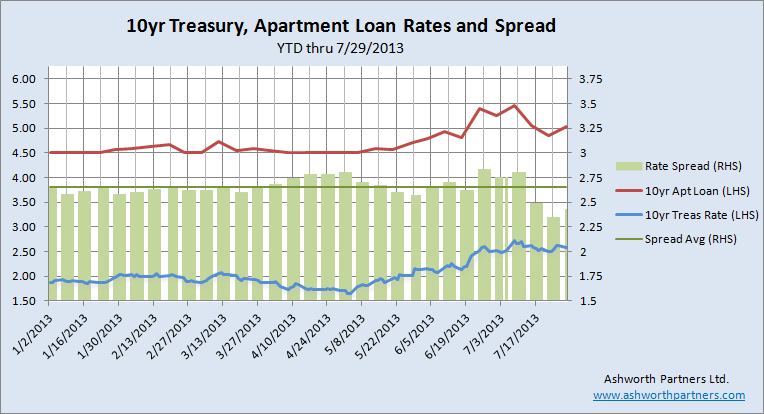
Quick update: The 10 year Treasury (T10) climbed back up into the 2.60% range while the 10 year fixed apartment building loan we track moved up to 5.033%. The spread between them widened to 242bp but remains below the 2013 average of 265bp. This week we’ve added the darker green line to show the average spread between the T10 and the apartment rate on the chart. Note that it uses the Right Hand Scale along with the spread itself:

10 year Treasury rate vs 10 year fixed apartment building investment loan July 2013
10yr Treasury Rate via St. Louis Fed’s FRED data, contact us about the apartment loan rate and details: www.ashworthpartners.com

For details on the apartment loan we track see the notes in last week’s post here: Apartment Building Loan Rates Fall as Spreads Narrow.

How the St. Louis Fed calculates the 10 year Treasury rate displayed above: “Treasury Yield Curve Rates. These rates are Continue reading 10yr Treasury back in 2.6% range bringing apartment loan rates up. The spread also widened but remained below 2013 average.

Update on Recession Probability: Rough Seas Ahead?

Back in March I posted a FRED chart that Bill McBride over at Calculated Risk shared tracking a set of data that pretty reliably coincides with recessions. Even better is that in almost fifty years of data there have been only two false positives which brings us to a very interesting point. First, here’s the chart as it appeared when I posted back in March:

FRED Recession Probabilities March 2013
Looks like pretty smooth sailing since 2010

Next let’s look in more detail at those false positives:

FRED Recession Probabilities March Detail
FRED Recession Probabilities March 2013

This is what I like about this data series: Even if we set the bar as low as 5%, there have only been two instances Continue reading Update on Recession Probability: Rough Seas Ahead?

A Family Inflation Gauge for Everyday Americans; rent, food, energy, medical costs, education and childcare.

Yes the Fed is fighting DEflation but it sure doesn’t feel like deflation when we go to the store or pull up to the gas pump. While I am glad that Ben is battling the correct demon, it would be very helpful to know what ‘living inflation’ is doing to or for our apartment residents. Especially since on their National Apartment web conference earlier this week Reis said that in many of their largest 79 markets class B & C owners ability to raise rents has or soon will run into the 35% of income barrier. Watching what the costs of rent, food and beverages, energy and medical expenses are doing to our residents’ pocketbooks could guide us in raising rents.  Today Pragmatic Capitalism had a very interesting piece on just that.

Inflation Gauge for Apartment Building Investors and residents
Source: Pragmatic Capitalism http://pragcap.com/wp-content/uploads/2012/10/CPI1-e1349809833759.png

Right now ‘Family Inflation’ is in the 2% range but you can see that last year it was as high as 7% and that it’s quite volatile. Most of that feels like it could be from rising fuel costs but let’s take a look to see if we can find out what’s really going on. Continue reading A Family Inflation Gauge for Everyday Americans; rent, food, energy, medical costs, education and childcare.