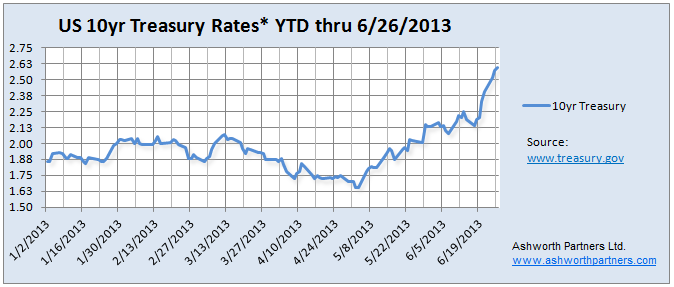
In the Analysis on Tapering QE3 post Tuesday I included a chart of the US 10 year Treasury rates and you could see them going vertical in the days since the Fed announcement and Bernanke’s press conference last week. We’re in the middle of negotiations on an apartment acquisition with a client and so what interest rates do over the next few days and weeks is extremely important to us. So here’s the updated chart:
Click for full size image. *Treasury Yield Curve Rates, commonly referred to as “Constant Maturity Treasury” rates, or CMTs. This method provides a yield for a 10 year maturity even if no outstanding security has exactly 10 years remaining to maturity. More at www.treasury.gov
Bill McBride over at Calculated Risk stares at this stuff all day and has a pretty good track record reading the Fed’s tea leaves. He believes that actual ‘tapering’ of QE3 purchases most likely won’t start before December although there is a slight possibility that it could happen in September if…..
3rd Qtr. GDP rose enough to make 2013 growth look like it will hit the low to mid 2% range.
Unemployment would have to dip enough to make it likely to get down to 7.2%-ish by year end.
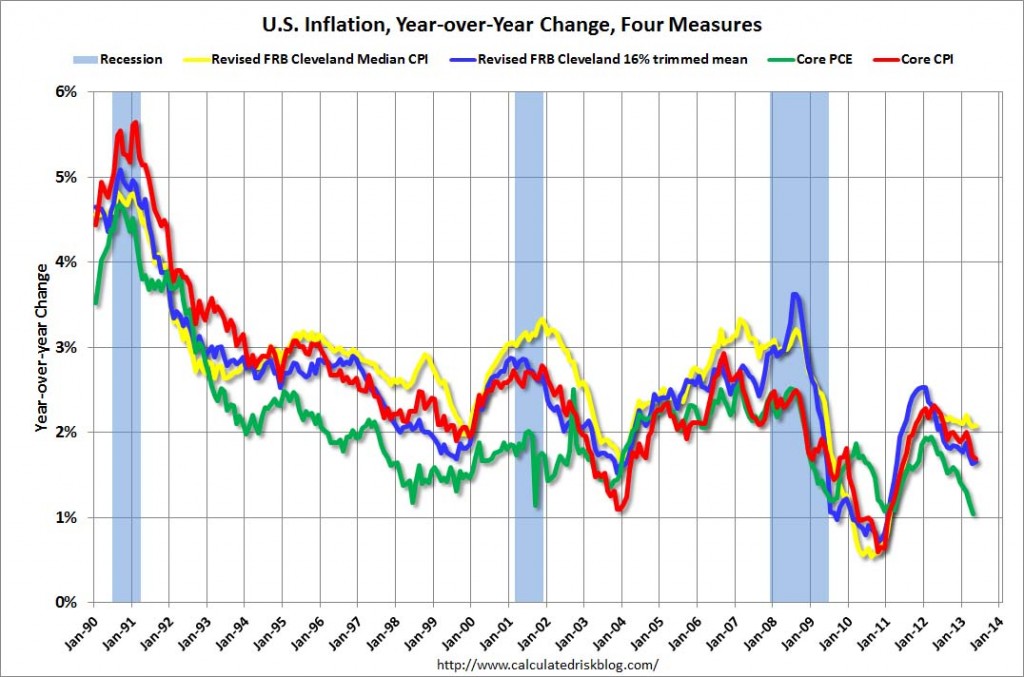
Inflation has to be increasing. Currently the trend is in the wrong direction and Q1 produced only .3% which is well below the 2% annual the Fed Wants.
See Bill’s analysis here: Analysis on Tapering QE3 I highly recommend following Bill’s blog and this is just one of several posts in the last week on Fed comments around the end of tapering. Here’s the inflation chart he posted last week showing four different measures of inflation, note the trend since the beginning of the year:
Click on image to go to Calculated Risk article with chart.
Tom Barrack was on CNBC last week to talk about real estate with the traders. Great TB quote to open the show: “It’s always great to be the slowest guy on Fast Money”. There’s more wisdom in that statement than any of the show’s regulars understood.
A couple bullet points but definitely worth watching the video. The link on the image below goes to the Colony website where they edited the three segments together (commercial free too):
Housing [of all types] is the best opportunity. Today there might be a Fed bubble but there isn’t a housing bubble.
The rise in interest rates while not big and still low historically speaking, will hit entry level housing. 100bp (basis point, where 100bp = 1%) rise in interest rates will cost a borrower an extra $150+/- a month on their mortgage payment for a $200,000 home. That will keep more people renting.
Click on the image to go to the Colony website video (no commercials)
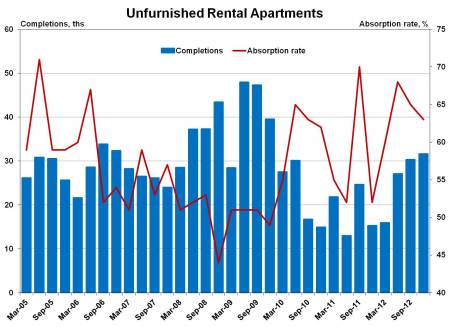
The NAHB (National Association of Home Builders) Eye on Housing out late last week included a chart of 5+ unit apartment building construction and absorption in the US. Built with the latest data from the Census Bureau’s SOMA (Survey of Market Absorption of Apartments, xls available here) is shows that absorption is holding in around 65% even while construction of new units is picking up:
According to the ASU W.P. Carey School of Business’ Phoenix Housing Market Explained presentation, PHX will have to add housing equal to the current size of the Denver metro area over the next two or three decades to hold all the people who will move there. This presentation was done in March of this year but the demographics are powerful and still operating. Watch minutes 5 to 25 for the market demographics, after that they dive into the specifics of the single family sector recovery.
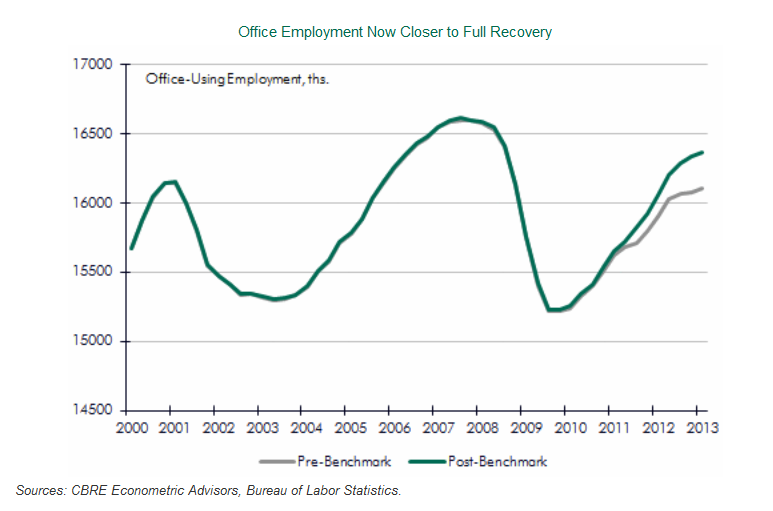
Interesting report from CBRE Econometric Advisors on the revised employment numbers just out from the Bureau of Labor Statistics’ (BLS). The BLS updates their employment numbers every year to reduce the error rate from their regular surveys and the revisions were up:
Click for full size image.
It is important to understand that the employment data produced by the BLS are based on a survey and therefore are subject to sampling error. As part of its survey methodology, the BLS completes a re-benchmarking of its payroll employment data annually, to account for any job gains or losses that were missed over the course of the past year. The payroll survey consists of a sample of 145,000 businesses and government agencies covering 557,000 worksites throughout the U.S. The BLS uses a birth-death model to account for changes not directly reported in its sample due to business openings and closings.
In order to adjust for missing information that could cause the birth-death model to miss its mark, the BLS annually benches its estimates to unemployment compensation records, to allow for a reconciliation of total payroll employment. Although the largest changes are always seen in the most recent year or two, estimates as far back as five years may be measurably altered, which can have a significant effect on how the labor market is seen to have affected commercial real estate demand. The process is first done at the national level, and then at the state and local levels.