Skate to where the apartment building investment puck is going: Top US markets for future population and job growth.

A lot of the usual suspects when it comes to multifamily markets have moved pretty far into their cycles and if your home area is like ours ti’s getting pretty fully priced. With our value investor mindset that means we’re looking for the next markets to do well over the coming 10-20 years. As apartment building investors we say:

Show Me The Apartment Building Investment Markets

Fortunately two different sources provided data and maps to answer Jerry’s demand. The first is from the NAHB (the National Association of Home Builders) in an Eye On Housing piece called Uneven Aging. The report actually has two maps, the first showing the 2000 to 2010 growth in the Continue reading Skate to where the apartment building investment puck is going: Top US markets for future population and job growth.
Multifamily Loan Rates Moderate Then Dip, Good For Apartment Building Investors.

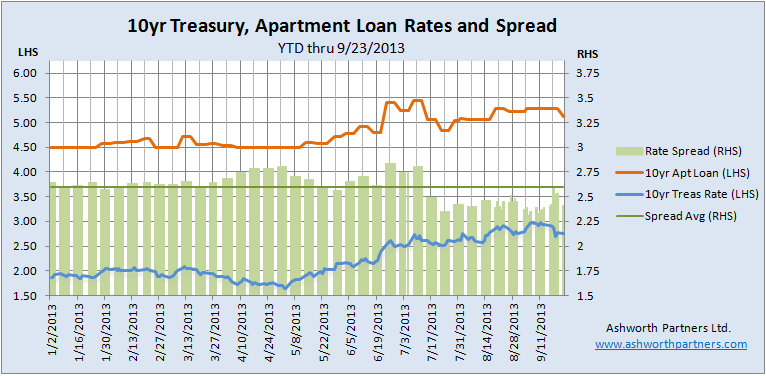
10 year apartment building loan rates had been in a range the last few weeks until Ben Bernanke ‘failed to taper’ last Wednesday causing the bellwether 10 Year Treasury to fall about a dozen basis points to today’s quote of 2.72%. This is good news for apartment building investors, home buyers and builders, stock market speculators, just about everyone except savers, retirees and the people running retirement plans. The upside is that loan rates may head lower but the downside is the economy and particularly employment haven’t improved enough to ease off the money printing pedal.

Here’s the latest chart showing the T10, the 10 year fixed apartment rate we track and the spread between the two:

10 year fixed apartment building investment loan rate lower

This week’s quote for a 10 year fixed rate, 30 year amortization apartment loan is 5.131%. (See below for more detail on this loan). The other thing noticeable on the chart is that the spread between the rates has been below the yearly average consistently since the beginning of July. In fact the average spread has fallen to 2.602 from 2.661 over that period. Partly because 4.5% was about as low apartment rates were going to go no matter how far down Treasuries went but also I think that lenders are getting more aggressive, especially in the multifamily sector.

Continue reading Multifamily Loan Rates Moderate Then Dip, Good For Apartment Building Investors.

Job growth vs. revenue growth chart of top apartment building investment markets in the US- updated.

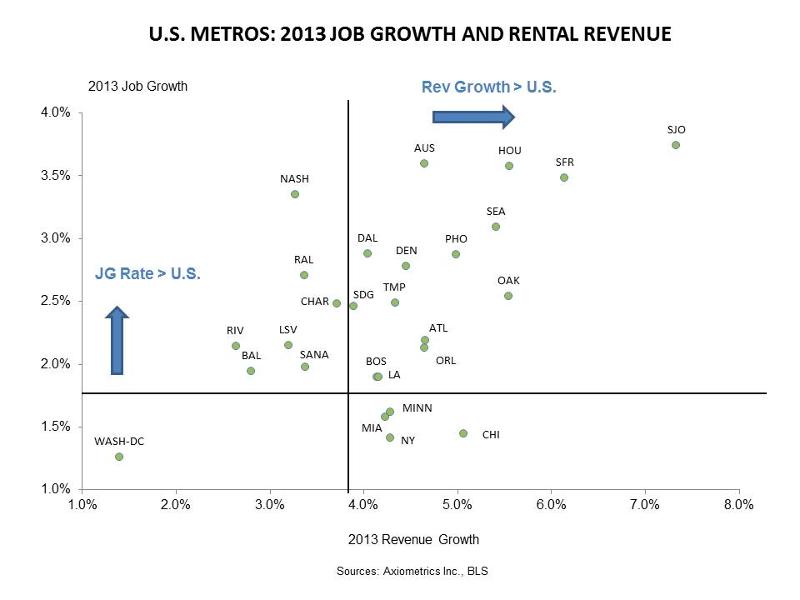
Back in February we posted an Axiometrics chart plotting the revenue growth vs. job growth in leading apartment investment markets in the US. They were out last week with an updated chart but not just in the way we might think since the numbers are Axiometrics’ 2013 forecasts for revenue and job growth updated through May this year. To me the real ‘update’ is that they reversed the axises on the chart and I think it makes more sense laid out this way:

Job Growth and Rent Growth for Apartment Building Investment
Click for full size image. Source: Axiometrics

Before I get sidetracked onto a long discussion on the importance of understanding just Continue reading Job growth vs. revenue growth chart of top apartment building investment markets in the US- updated.

Employment recovery is better than we thought. Good for CRE and apartment building investment.

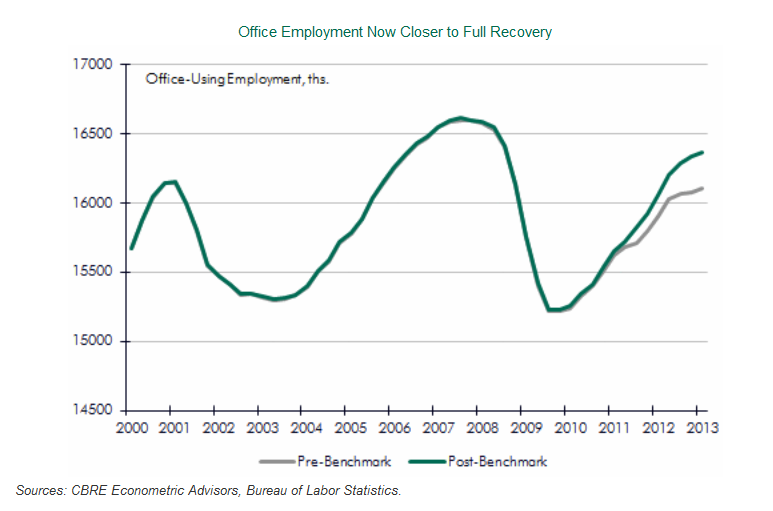
Interesting report from CBRE Econometric Advisors on the revised employment numbers just out from the Bureau of Labor Statistics’ (BLS). The BLS updates their employment numbers every year to reduce the error rate from their regular surveys and the revisions were up:

Employment Closer to Full Recovery, Good for Apartment Building Investment
Click for full size image.

It is important to understand that the employment data produced by the BLS are based on a survey and therefore are subject to sampling error. As part of its survey methodology, the BLS completes a re-benchmarking of its payroll employment data annually, to account for any job gains or losses that were missed over the course of the past year. The payroll survey consists of a sample of 145,000 businesses and government agencies covering 557,000 worksites throughout the U.S. The BLS uses a birth-death model to account for changes not directly reported in its sample due to business openings and closings.

In order to adjust for missing information that could cause the birth-death model to miss its mark, the BLS annually benches its estimates to unemployment compensation records, to allow for a reconciliation of total payroll employment. Although the largest changes are always seen in the most recent year or two, estimates as far back as five years may be measurably altered, which can have a significant effect on how the labor market is seen to have affected commercial real estate demand. The process is first done at the national level, and then at the state and local levels.

The upward revision shows that total employment growth the last two years was Continue reading Employment recovery is better than we thought. Good for CRE and apartment building investment.

Apartment Building Replacement Costs Rising: lumber back to housing boom highs, growing labor shortages.

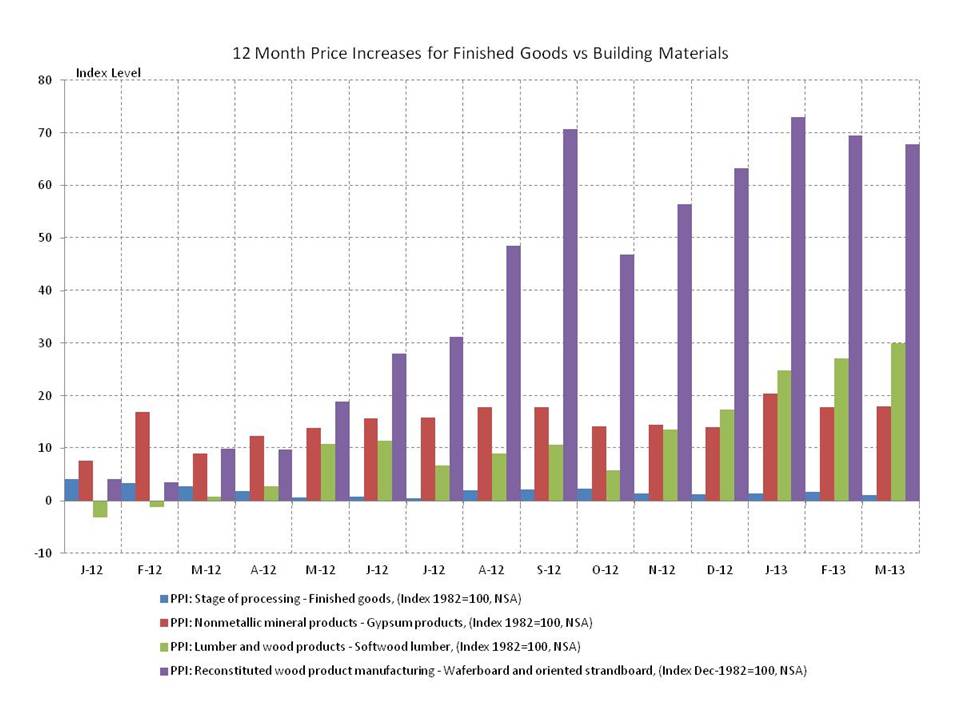
The NAHB has a piece out called Producer Prices in March – Building Materials Prices Approaching Housing Boom Highs talking about how far gypsum (main ingredient in drywall +18%), softwood lumber (2x4s, 2x6s, etc. +30%) and chipboard (oriented strand board and waferboard which have replaced plywood, joists and beams in many applications +68%) prices have risen in the last year, the chart tells the story:

Apartment Building Material Prices 2012 to Mar 2013
Click on chart for full size image.

Bill McBride over at Calculated Risk has a piece showing the longer term price history for Random Length Lumber (2x4s only, both cash and futures) and a link to a pretty depressing Vancouver Sun article on pine beetle devastation in BC (Spoiler alert: the Continue reading Apartment Building Replacement Costs Rising: lumber back to housing boom highs, growing labor shortages.

CoreLogic Map: Almost 23 Million Zombie Homeowners Still Underwater.

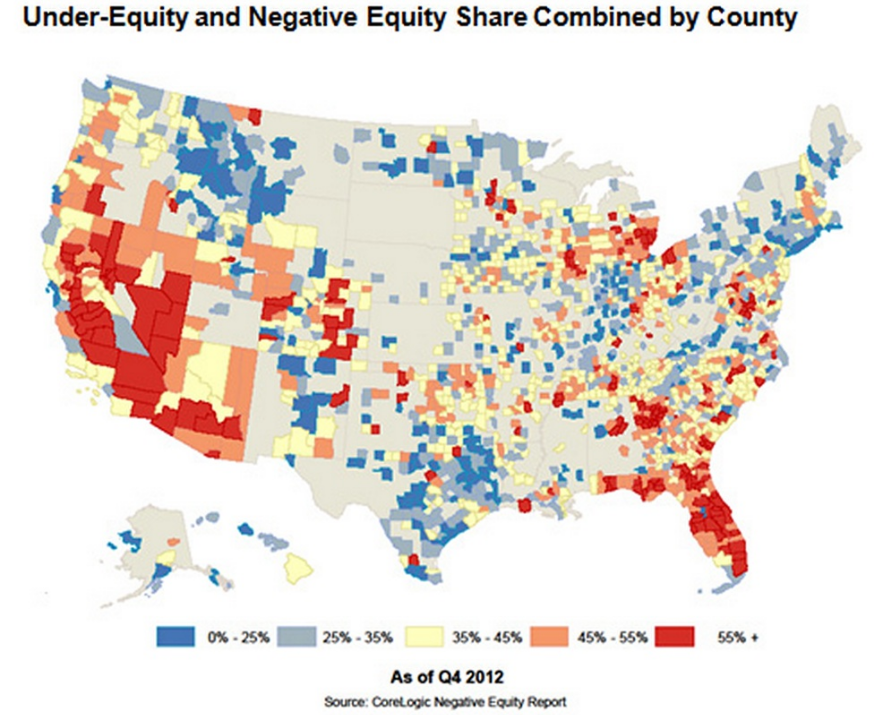
CoreLogic is out with their quarterly report and map of underwater homeowners. Their analysis is “showing approximately 200,000 more residential properties returned to a state of positive equity during the fourth quarter of 2012. This brings the total number of properties that moved from negative to positive equity in 2012 to 1.7 million and the number of mortgaged residential properties with equity to 38.1 million. The analysis also shows that 10.4 million, or 21.5 percent of all residential properties with a mortgage, were still in negative equity at the end of the fourth quarter of 2012. This figure is down from 10.6 million* properties, or 22 percent, at the end of the third quarter of 2012.

Negative equity, often referred to as “underwater” or “upside down,” means that borrowers owe more on their mortgages than their homes are worth. Negative equity can occur because of a decline in value, an increase in mortgage debt or a combination of both.

CoreLogic Homeowner Negative Equity Map

Of the 38.1 million residential properties with positive equity, 11.3 million have less than 20 percent equity. Borrowers with less than 20 percent equity Continue reading CoreLogic Map: Almost 23 Million Zombie Homeowners Still Underwater.

Top 5 Apartmentment Building Investment Markets for Rent Growth, by Asset Class.

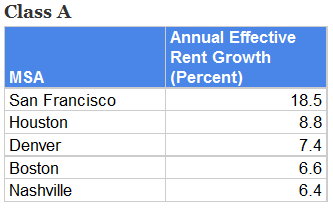
In an update to our earlier update on top markets, Axiometrics has put out a report on the top 5 apartment building investment markets for rent growth by asset class.

Top 5 Class A Apartment Building Investment Markets for Rent Growth

San Francisco is rocking in class A and B, and in class C it’s….. San Francisco! Interestingly A and C properties there are showing rent growth of almost twenty percent while class B is just under ten percent. Any thoughts on why A and C are double the class B rent growth in SF? Note that 9.3% in class B still leads the US- Continue reading Top 5 Apartmentment Building Investment Markets for Rent Growth, by Asset Class.

Q3 Apartment Building Investment Reports Now Available From Marcus & Millichap

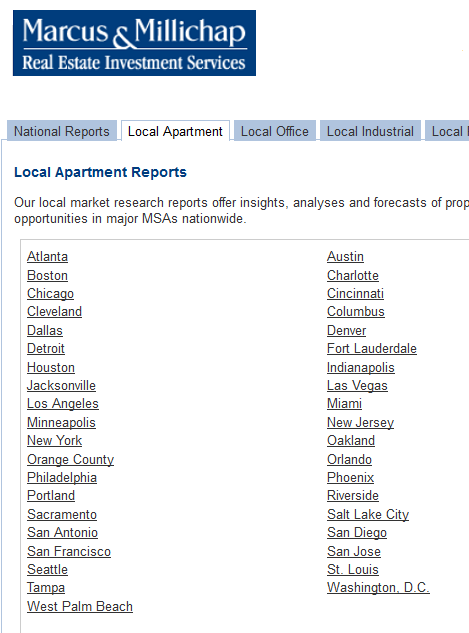
M&M covers 39 major apartment building investment markets in the US and have just published their Q3 reports. Here’s a list of the metros they cover:

Marcus & Millichap Q3 2012 Apartment Building Investment Market ReportsThey also provide snapshots of the Office, Industrial, Retail and Self-storage sectors in many of those markets, accessible from the tabs on the page. Note this information requires registration at the website to view.

UPDATE: Top 10 US Submarkets for new apartment building units in the pipeline.

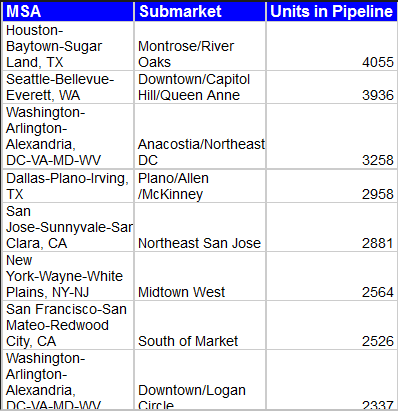
In May we posted an article Top 10 US Cities for new apartment building permits where Seattle came in sixth in new apartment building units permitted. Now a new list is out from Axiometrics with a breakdown by submarket and Seattle’s Downtown/Capitol Hill/Queen Anne submarket lands at number two with almost 4,000 units due to come on line in the near future.

Seattle number 2 in Top 10 most new apartment units in the pipeline

And that’s on top of nearly 6,000 units (3,500 in the last two years) that have already been delivered downtown since 2005. Plus there are several other hot neighborhoods such as Belltown and South Lake Union that Continue reading UPDATE: Top 10 US Submarkets for new apartment building units in the pipeline.

Even in Slow Jobs Climate Apartment Buildings Leasing Well- National Occupancy now over 94%

Just got an email from Jay Denton, Research VP at AXIOMetrics saying the national apartment building occupancy is 94.3%, a level not seen since 2006. Class A occupancy is at 95.5%, class B is 94.8% and class C is 92%. Also many submarkets around the country will see the first new supply of units this summer. Even so properties in Lease Up are doing well, averaging more than 20 move-ins a month. Further strength in the market is reflected by the fact that concessions are down to only 2-3 weeks in many markets.

Apartment Building Invesment Revenue Rents Occupancy

Jay also shared an interesting idea for a leading indicator of Continue reading Even in Slow Jobs Climate Apartment Buildings Leasing Well- National Occupancy now over 94%