Latest Commercial RE and Apartment Building Investment Cycle Charts Posted by Glenn Mueller PhD.

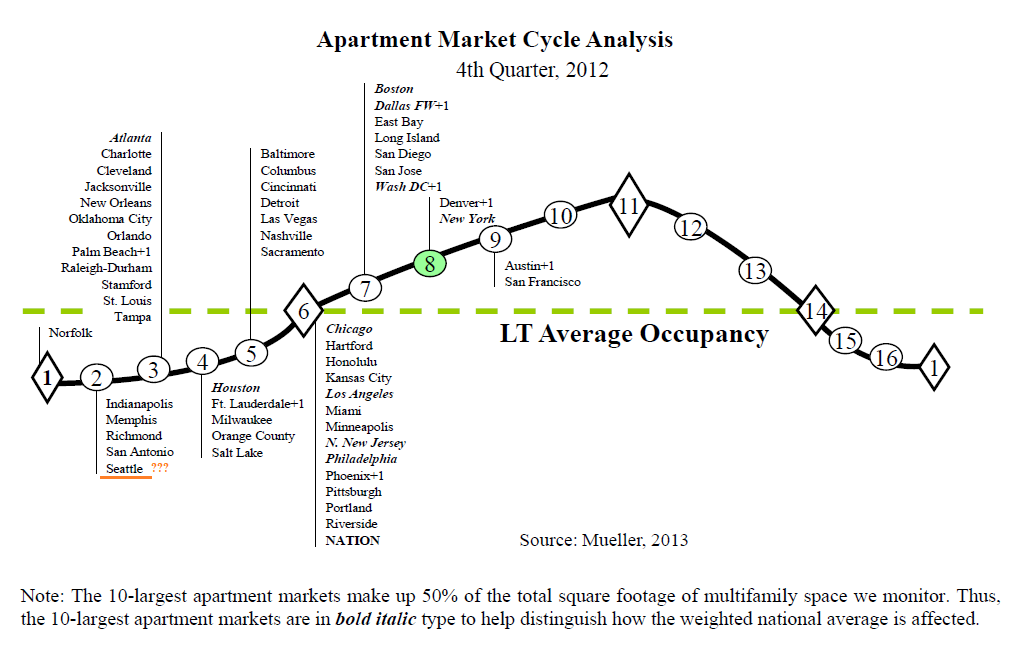
…. “Only six markets advanced their position on the [Dividend Capital Apartment Market] cycle chart.” Once again with the notable exception of Seattle who has left in the basement of the cycle despite overwhelming evidence that it has moved well up in the cycle by his own definition. See my post from last quarter detailing the definitions and why Seattle’s apartment building investment cycle location according to Dr. Mueller is incorrect here. For other cities have a look and let me know if your markets are accurately placed:

Apartment Building Investmet Cycle Chart Q4 2012

Is it a Seattle thing? Is he the Brent Musburger of commercial real estate? Continue reading Latest Commercial RE and Apartment Building Investment Cycle Charts Posted by Glenn Mueller PhD.

Apartment Building Occupancy, Effective Rents and Revenues Charted. How are yours?

Axiometrics was out with their National Monthly Apartment Trends report which includes a couple of cool charts, one is a map of their top 88 markets coded by rent growth (below). The one that caught my eye though was showing Occupancy, Effective Rents and Revenues:

Apartment Building Investment Occupancy, Effective Rents and Revenue

From the chart it looks like the national average of Continue reading Apartment Building Occupancy, Effective Rents and Revenues Charted. How are yours?

US Apartment Building Vacancy Below 5%, Rents Growing at Fastest Pace Since ’07.

Apartment Building Vacancies Plunge to 2001 Levels

 Main bullet points from Reis Report’s Q2 Apartment Highlights:

  • National vacancies continue to plunge, ending Q2 at 4.7%.
  • There was a slight moderation in vacancy compression, following 10 quarters of vacancy declines.
  • With such low vacancy levels, landlords have been accelerating rent increases.
  • Effective rents increased 1.3%, the fastest pace since Q3, 2007.
  • Inventory growth remains restrained with just 10,000 units coming online.
  • Developers are starting to build more properties to take advantage of the tight market conditions.

vacancy below five percent for US apartment building investorsHow are vacancy and effective rents trending in your market?

Even in Slow Jobs Climate Apartment Buildings Leasing Well- National Occupancy now over 94%

Just got an email from Jay Denton, Research VP at AXIOMetrics saying the national apartment building occupancy is 94.3%, a level not seen since 2006. Class A occupancy is at 95.5%, class B is 94.8% and class C is 92%. Also many submarkets around the country will see the first new supply of units this summer. Even so properties in Lease Up are doing well, averaging more than 20 move-ins a month. Further strength in the market is reflected by the fact that concessions are down to only 2-3 weeks in many markets.

Apartment Building Invesment Revenue Rents Occupancy

Jay also shared an interesting idea for a leading indicator of Continue reading Even in Slow Jobs Climate Apartment Buildings Leasing Well- National Occupancy now over 94%