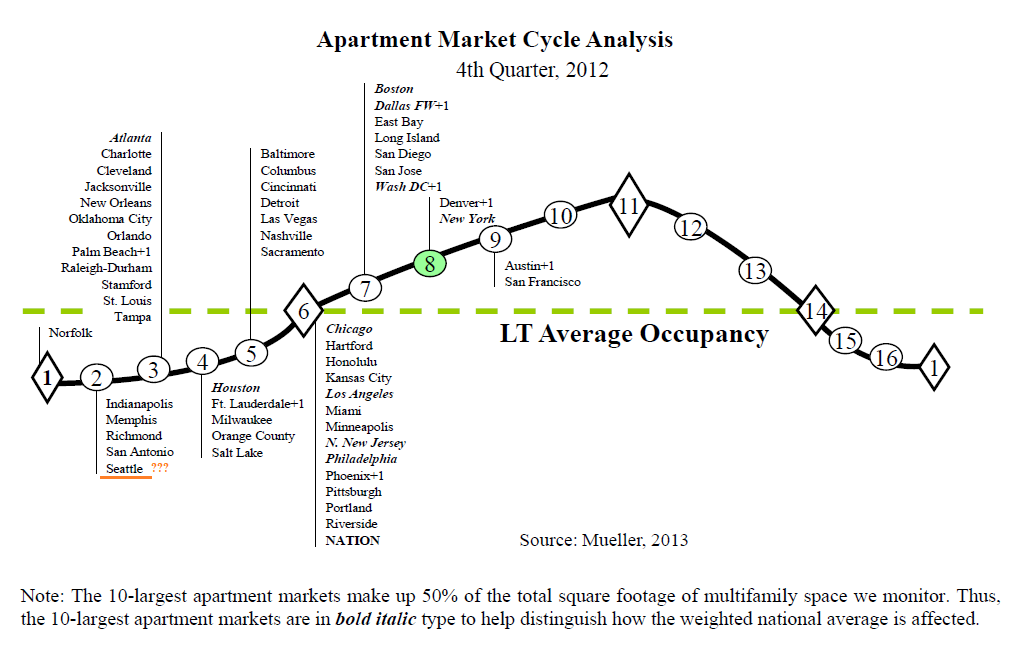
…. “Only six markets advanced their position on the [Dividend Capital Apartment Market] cycle chart.” Once again with the notable exception of Seattle who has left in the basement of the cycle despite overwhelming evidence that it has moved well up in the cycle by his own definition. See my post from last quarter detailing the definitions and why Seattle’s apartment building investment cycle location according to Dr. Mueller is incorrect here. For other cities have a look and let me know if your markets are accurately placed:
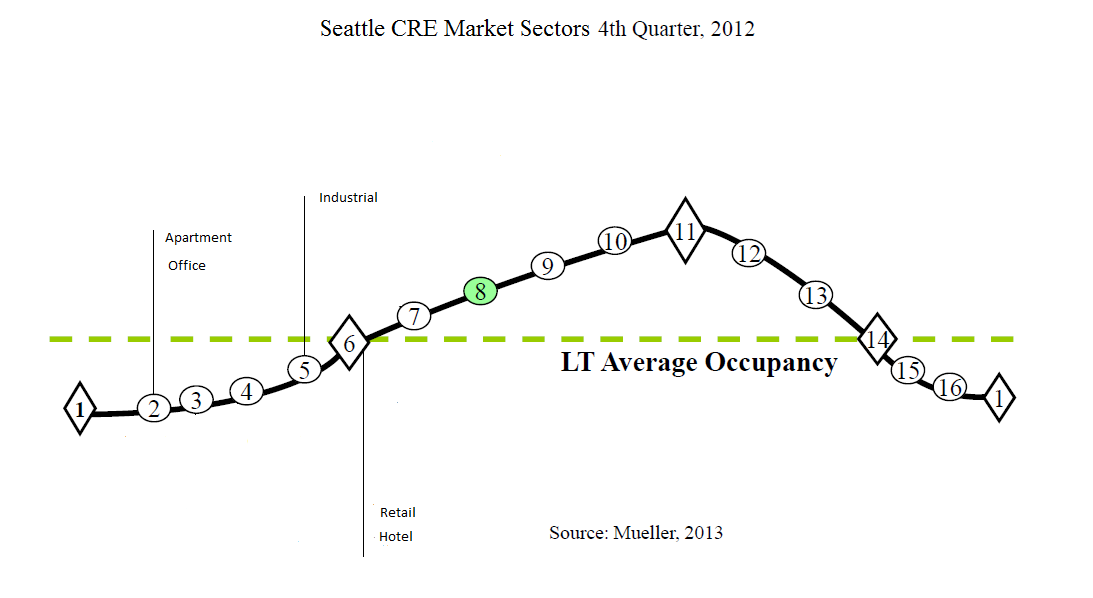
Is it a Seattle thing? Is he the Brent Musburger of commercial real estate? What other explanation is there for one of the leading researchers and professors of real estate cycles to miss so badly and repeatedly? Just to check I plotted his Seattle sector locations on a separate chart to see if a pattern emerged:
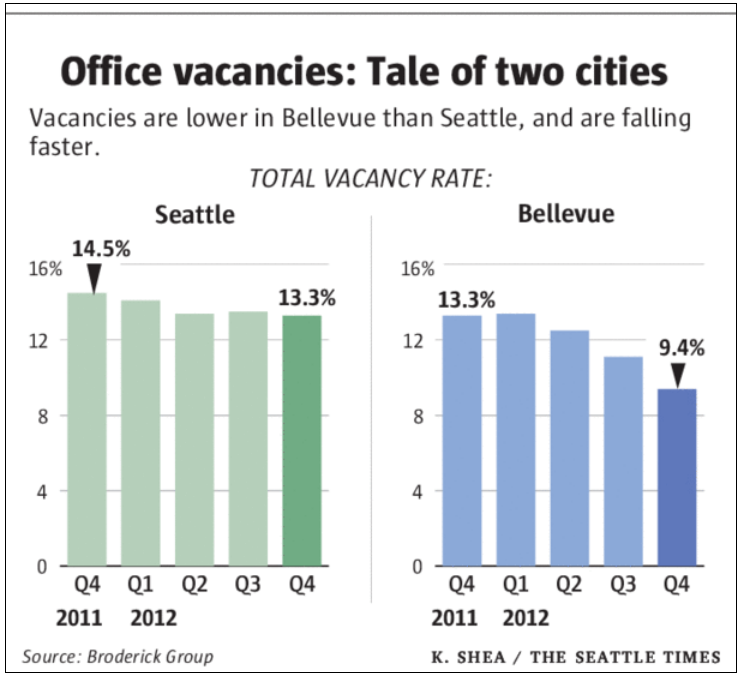
With vacancy falling from 14.5% to 13.3% in 2012 the Seattle office market seems properly located:
Seattle’s industrial market placement looks OK with Vacancy falling to 3.4% and little new construction:

The retail market in Seattle is a tougher call with occupancy at 93% (falling in Seattle downtown but rising across the region as a whole) and lease rates falling or rising depending on how tightly you define Seattle:

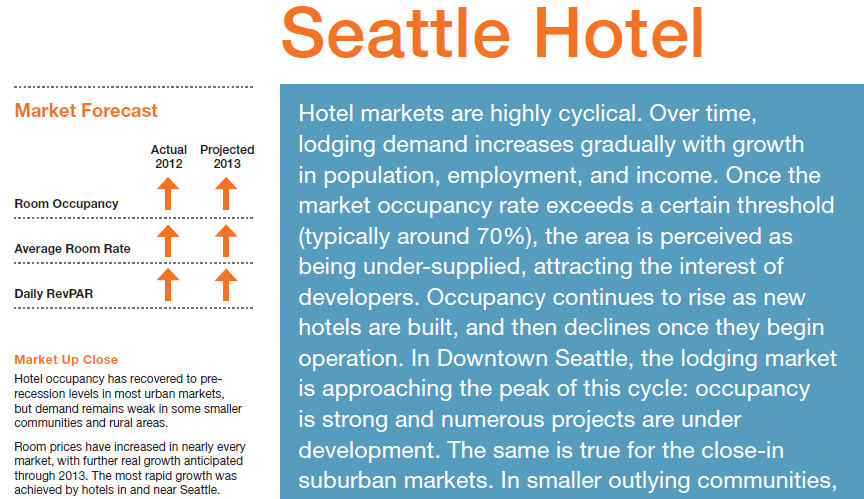
Professor Mueller’s placement of the Seattle hotel market might be a little behind the trend, at least according to Kidder Matthews. Occupancy, room rates and Rev/PAR all up, but since there’s been no new construction in the last three years (although 10 are in the pipeline) the hotel market is correctly placed in the cycle:
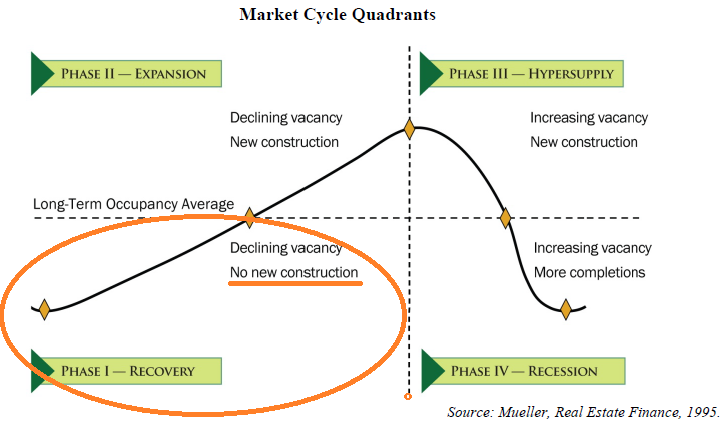
So three spot on calls and one arguably OK call doesn’t indicate that Seattle just fell off Dr. Mueller’s data set. So what explains the completely off the chart placing of Seattle’s apartment market? According to his research (which I believe is an accurate description of the cycle) to be placed at position 2 in the cycle three critical facts have to line up: 1. Negative Rental Growth, 2. No New Construction and 3. Occupancy Below Long Term Average:

Let’s look at the Seattle apartment building investment market point by point: 1. Negative Rental Growth:
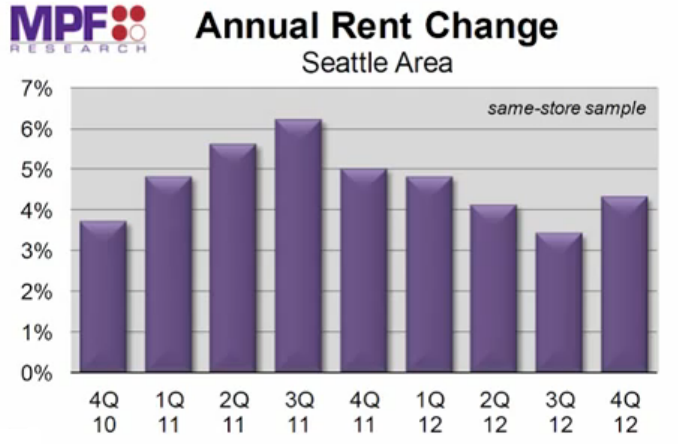
Not the five or six plus rent growth of 2011 but I’ll take four percent plus any day. How would your proforma look if you plugged in 4% rent growth?
How about 2. No New Construction? The MFP guys were shocked, shocked I tell you, that Seattle rents climbed above 4% because it was (and will be):
Absolutely inundated with new supply in the last three months of the year and yet still turned in a surprisingly strong performance.
In Seattle they’re building multis like it’s 1985 (Que the Prince/ ![]() track):
track):

The next few years will produce more new units than we’ve seen in over 20 years,” Patty Dupre said in Dupre + Scott Apartment Advisors’ September report. “It may even be a record. Specifically, developers are planning to open 35,000 apartments between 2012 and 2017. Of those, 18,400 are already under construction or completed, and construction of another 1,700 is set to start in the next 30 days.- Sep. 2012
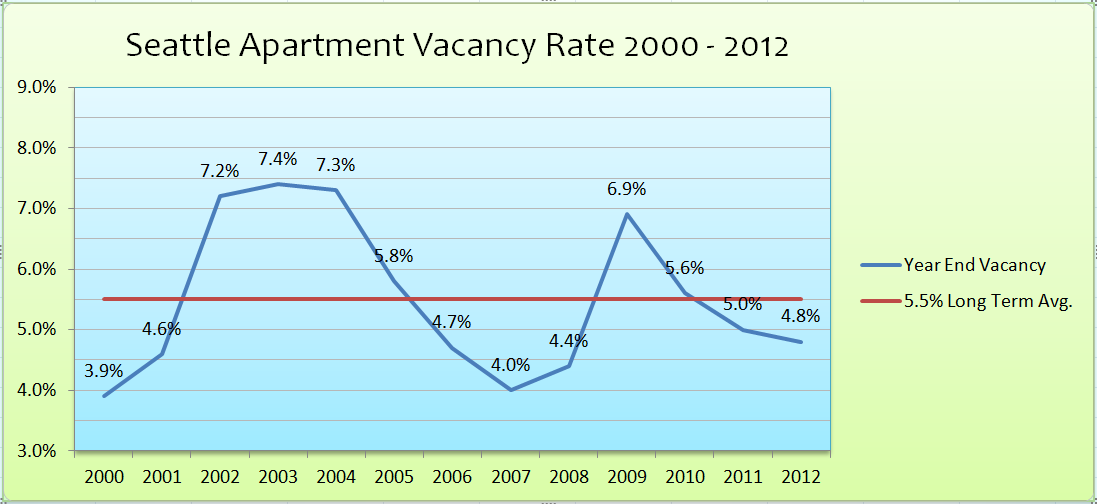
So that leaves 3. Occupancy Below Long Term Average. According to numerous sources the long-term average occupancy (occupancy = 1 – vacancy%) in Seattle since 2000 is 94.5% and vacancy last year came in at 95.2%, therefore above the long term average:
So to sum up: Positive rent growth of 4%; An “Inundation” of new supply; Occupancy above long-term average: Definitely not at position 2 in the depths of the Recovery Phase. The kick up of rent growth in Q4 makes the placement tricky but the Seattle apartment market is at least near the peak of the cycle if not rolling over into Hypersupply. With all the new supply coming online this year owners will have to battle to hang onto rent gains and effective rents (asking rents less concessions) will be where the cycle turn is confirmed. Dr. Mueller apparently isn’t the Brent Musburger of CRE but maybe he is the Brent Musburger of Apartment Investment?
Where is your apartment market compared to where it is placed on Dr. Mueller’s chart?
Interestingly just ran across an Axiometrics piece that shows effective rents in Seattle were up 7% last year- http://bit.ly/WKJvJA It could be a difference in which properties different researchers track, their methodology or that Seattle could continue to peak for a while.
In a ‘sign of the times’ quote from the same article: “Many of the properties in that submarket use revenue management, so we might simply see the quoted rent shift down rather than the widespread use of concessions.”