Apartment Building Investment Still Leads as CRE Prices Up 11% YoY in CoStar’s Repeat Sales Indexes

CoStar is out with their latest Commercial Repeat Sale Indices (CCRSI) showing that:

  • Commercial Real Estate prices post double-digit annual gains in May
  • Momentum picks up in the General Commercial segment
  • Improvements in market fundamentals underpin growth in commercial property pricing
  • Capital flows remain healthy
  • Distress levels continue to dissipate
  • See link for numbers and details-

Commercial Real Estate Up 11% YoY in May 2014

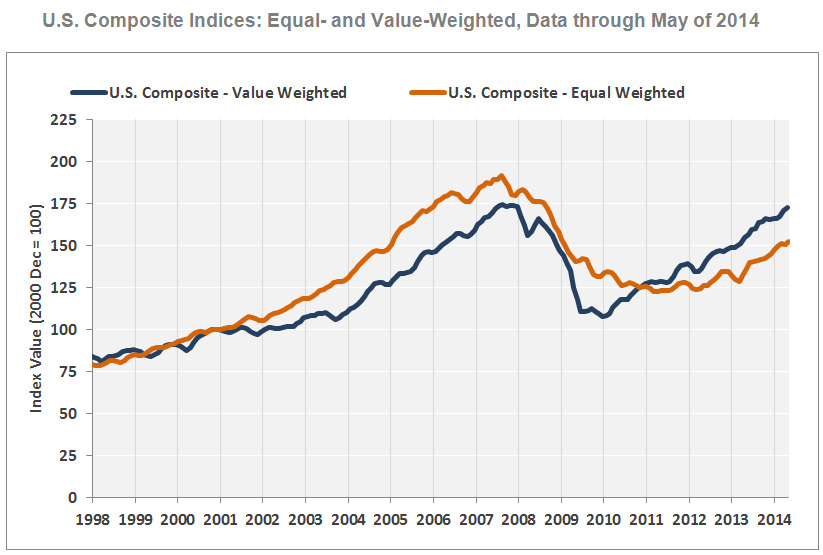
CoStar has been tracking the indexes of repeat commercial real estate sales since 1996. Note that the Value Weighted index is driven mostly by core properties while the Equal Weighted index is mostly driven by smaller, non-core property sales.

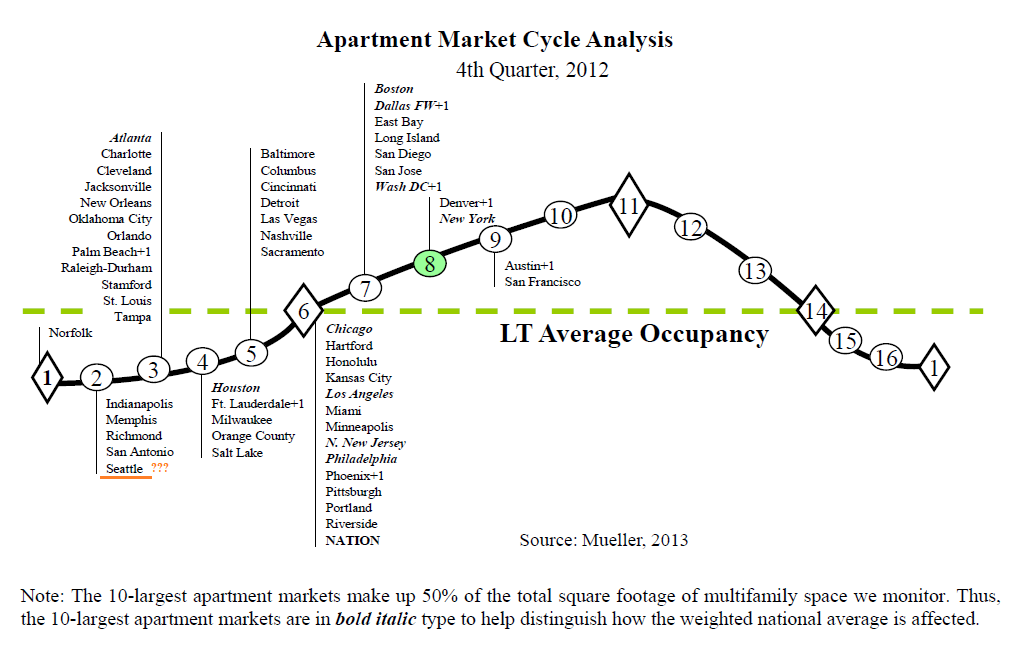
For apartment building investors the good news is that Continue reading Apartment Building Investment Still Leads as CRE Prices Up 11% YoY in CoStar’s Repeat Sales Indexes

Apartment Building Investment Rocks Q2 across the US (video)

That happy feet sound you hear is coming from apartment building investors as they see their results from the second quarter:

  • Rents Up
  • Vacancy Down
  • New Supply Being Absorbed as soon and it’s built

Here’s the video report from MPF Research:

And it’s not just the usual Continue reading Apartment Building Investment Rocks Q2 across the US (video)

More important than unemployment for apartment building investors?

We all know that jobs are a critical driver of the apartment building investment cycle and so we dutifully follow along with the talking heads when the unemployment number is estimated, released and then its potent debated.  But Mike Scott over at Dupre+Scott points out in a piece posted Friday that apartment building investors should be following employment, not unemployment. Specifically he recommends measuring how many jobs it takes to create demand for one apartment unit. Currently in King County (where Seattle is the county seat and where Dupre+Scott is located) it takes about 8 jobs to do that:

jobs required to fill one multifamily unit
Source: http://www.duprescott.com Note that we compressed Mike’s four charts into one for brevity.

The formula is simple: Net new jobs / apartment units absorbed. And if you’re an multifamily investor in the tri-county area (King, Pierce and Snohomish in WA State) that Dupre+Scott provides apartment investment research for, they’d be happy to supply you this information http://www.duprescott.com.

Looking at the chart we can see that while currently it takes about eight jobs to fill one unit it wasn’t always so and in fact the twenty year average is closer to nine. Mike explains Continue reading More important than unemployment for apartment building investors?

The ‘Twin Peaks’ of Seattle Apartment Building Investment Plus MPF Research says rent growth holding strong there.

Friday twofer on Seattle. First is Dupre+Scott’s  entertaining and enlightening video on apartment building construction and property sales:

Mike has two nice charts showing apartment development numbers back to 1988 and sales volume back to 1981. Note that on the sales volume chart 2013 numbers are Continue reading The ‘Twin Peaks’ of Seattle Apartment Building Investment Plus MPF Research says rent growth holding strong there.

Latest Commercial RE and Apartment Building Investment Cycle Charts Posted by Glenn Mueller PhD.

…. “Only six markets advanced their position on the [Dividend Capital Apartment Market] cycle chart.” Once again with the notable exception of Seattle who has left in the basement of the cycle despite overwhelming evidence that it has moved well up in the cycle by his own definition. See my post from last quarter detailing the definitions and why Seattle’s apartment building investment cycle location according to Dr. Mueller is incorrect here. For other cities have a look and let me know if your markets are accurately placed:

Apartment Building Investmet Cycle Chart Q4 2012

Is it a Seattle thing? Is he the Brent Musburger of commercial real estate? Continue reading Latest Commercial RE and Apartment Building Investment Cycle Charts Posted by Glenn Mueller PhD.

Apartment Building Permits Rise to Long-term Average while Vacancy Index Remains Low

In their latest apartment building permitting report Axiometrics says: “permitting increased 44.3% or 84,308 units from the January 2012 figure of 274,640 units.” This is very near the long term average of 280,000 units, see the chart:

Apartment Building Investment New Construction Permits

Note that single family permits are still Continue reading Apartment Building Permits Rise to Long-term Average while Vacancy Index Remains Low

SOMA (Survey of Market Absorption of Apartments) charted by apartment type from the Census Bureau

The NAHB was out with their weekly Eye on Housing report and this week’s edition took a look at the Q3 SOMA data from the Census Bureau. SOMA stands for Survey of Market Absorption of Apartments and overall things are looking pretty positive for developers. One interesting chart they had showed the types of properties that were being built since 2005:

Apartment Building Investment since 2005 by type

Condos and co-op deliveries are Continue reading SOMA (Survey of Market Absorption of Apartments) charted by apartment type from the Census Bureau

Risks to Apartment Overbuilding Averted, For Now says ReisReports

In a piece just out today ReisReports says that new apartment starts have been postponed to 2014 by many developers.

The “bubble” now shows up in 2014, but if economic growth ramps up, then additional supply will most likely be absorbed relatively painlessly.

But not all Metros escape. The report mentions Washington DC and suburban Maryland as two of those who will still see large increases in supply next year.

US Apartment Market moves big supply increase to 2014

Interestingly they name Seattle as a market that should be able to absorb the new supply coming because Continue reading Risks to Apartment Overbuilding Averted, For Now says ReisReports

UPDATE: Top 10 US Submarkets for new apartment building units in the pipeline.

In May we posted an article Top 10 US Cities for new apartment building permits where Seattle came in sixth in new apartment building units permitted. Now a new list is out from Axiometrics with a breakdown by submarket and Seattle’s Downtown/Capitol Hill/Queen Anne submarket lands at number two with almost 4,000 units due to come on line in the near future.

Seattle number 2 in Top 10 most new apartment units in the pipeline

And that’s on top of nearly 6,000 units (3,500 in the last two years) that have already been delivered downtown since 2005. Plus there are several other hot neighborhoods such as Belltown and South Lake Union that Continue reading UPDATE: Top 10 US Submarkets for new apartment building units in the pipeline.