Widely Followed Apartment Market Cycle Research Misses Widely

The Strange Tale of the Seattle Apartment Building Investment Cycle and Maybe Yours Too.

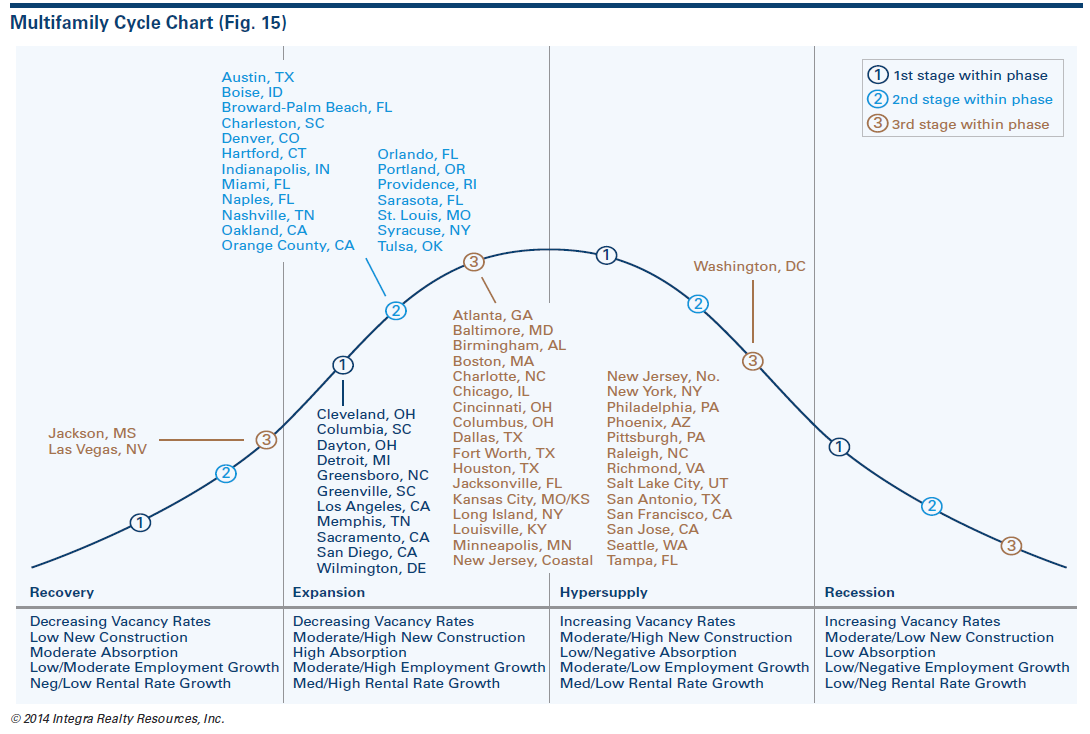
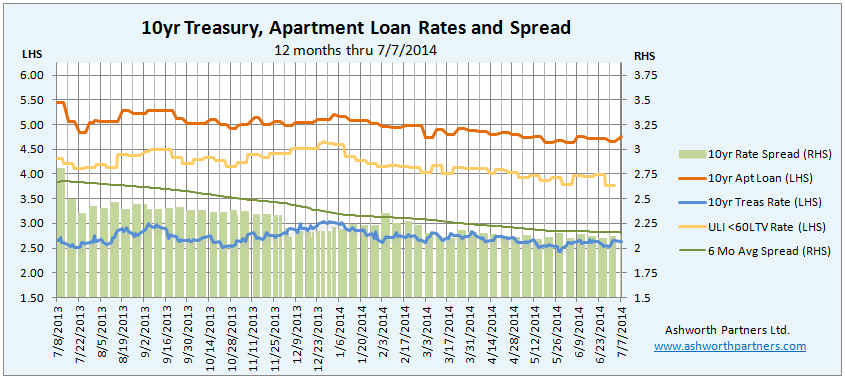
Back in 2012 it appeared that Seattle’s movement through the real estate cycle was stalling out. Not the actual market by any stretch of the imagination but instead where it was placed on the apartment market cycle charts in the Cycle Monitor report from Dividend Capital Research. These quarterly reports on the real estate market cycles for the five main Commercial Real Estate (CRE) sectors in more than fifty markets around the US were widely followed but something was wrong.

Seattle apartment occupancy vs. Cycle Monitor Market Position 2005 - 2014
Click on images for full size.

Why this up to date market data is vitally important to your investment success:

You can fix a property but not a market cycle. Knowing where a market is in its cycle is critical for investors seeking to buy low and sell high. If signals are a year or more behind, prime opportunities will be missed to Continue reading Widely Followed Apartment Market Cycle Research Misses Widely

Do You Know Where Your Apartment Market Is Right Now?

…In its investment cycle?

Well Integra Realty Resources (IRR) is just out with their 2015 Viewpoint Report covering where they think things are and where they might be headed in the five major sectors of Commercial Real Estate (CRE); office, industrial, retail, multifamily and hospitality… as well as a bonus piece on self-storage. IRR is one of the largest independent commercial real estate appraisal firms in the U.S and this is their 25th annual IRR Viewpoint in the fifteen year history of the company according to their chairman in his introduction. Not sure on the math there but I do have their reports going back to 2002.

In the report they cover cap rates, going-in cap rates, discount rates, yields, reversion rates and much more but the first thing I look at is their market cycle chart for the multifamily sector:

IRR Apartment Building Investment Cycle Chart Integra Realty Resources
Click on image for full size. Source: Integra Realty Resources

So IRR has an idea of where your apartment market is, provided your market is in one of the sixty plus places where they have an office. The big question is do you agree with their placement? It is very important to review the data and form your own idea on this because there are good reasons to doubt Continue reading Do You Know Where Your Apartment Market Is Right Now?

QE is the most destructive policy for housing in world history. – Dr. Peter Linneman Good for apartments?

Was on NAI Global’s call with Peter Linneman, their chief economist who had some very interesting things to say for apartment building and commercial real estate investors yesterday. Note he’s an actual real estate guy as well as a Wharton professor and I would have lobbied for a better job title at NAI with his background.

First is about the bombshell quote from above. Linneman said there are many studies about home buying that show the down payment is the issue not the mortgage payment and disputes the whole people buy a monthly payment thing.

If I don’t have the downpayment it doesn’t matter what the interest rate is.

Young people are having a very hard time saving for a downpayment at zero percent interest and their parents and grandparents can’t afford to help at zero percent interest on their savings either.  Linneman summed it up by putting it in a golfing context: It’s not the green fees it’s the club membership that make it expensive. Japan is the poster child for this bad policy, they’ve been doing QE for twenty five years and it’s done nothing to fix their problems.

The most interesting thing from a multifamily perspective was that he believes we’re at the beginning of the capital cycle for CRE including apartments:

apartment building investment loans a beginning of long up cycle

He also believes that cap rates will Continue reading QE is the most destructive policy for housing in world history. – Dr. Peter Linneman Good for apartments?

Increase NOI at Your Apartment Building with Fannie Mae’s Energy Star Findings

Fannie Mae launched their Energy Star program for apartment building investors by releasing their study on utility use. The report, called Transforming Multifamily Housing: Fannie Mae’s Green Initiative and ENERGY STAR for Multifamily (PDF). It’s loaded with great info on reducing energy and water use as well as stats on use broken up by unit, square foot and region. They also talk about their Green Preservation Plus loans which combined with certified Green Buildings they have financed $130 million in loans on as of Q1 2014. But let’s cut to the chase, key findings [Emphasis mine]:

  • On average, a 100,000 square foot property spends $125,000 on energy and $33,000 on water annually.
  • If this property saved 15% on energy and water costs, it would increase asset value by almost $400,000, at a 6% cap rate.
  • The least efficient properties use over three times as much energy and six times as much water per square foot as the most efficient properties.
  • When owners paid for all energy costs, median annual energy use was 26% higher than when tenants paid for them.
  • High-rise properties use almost 10% more energy per square foot than low-rise properties
  • Properties in the West use almost 50% more water per square foot compared to properties in the Northeast.

Clearly reducing common area utility costs and getting tenants to pay for their own use are the two of the best ways to improve Net Operating Income (NOI) and they have a nice graphic showing  just how to do that:

Reducing Utility Costs on Apartment Building Investments raises NOI

It’s an interesting finding that buildings in the West use Continue reading Increase NOI at Your Apartment Building with Fannie Mae’s Energy Star Findings

10yr Apartment Investment Loan Rate Steady While ULI <60LTV Rate Drifts Lower

The apartment building loan rate we track remains in the 4.6-4.7% range where it’s been since the middle of July. Meanwhile the ULI <60% LTV loan rate has fallen 10 basis points over the same period with its spread to the 10 year Treasury coming in from 1.32% to 1.27%. That’s a very slim margin indicating a very competitive market for those loans. Typically the 10yr apartment loan rate loosely tracks the ULI rate with a lag so we’re hoping to see the rate come in a little more for deals closing in the next few months.

While everyone seems to ‘know’ that rates must be going up influential economist Anatole Kaletsky (the Kal in GaveKal Research) makes a pretty convincing argument that the central bankers in the US, UK and Europe will be following their contemporaries over at the Bank of Japan, keeping rates ‘lower for longer’ in a piece out this week from Evergreen/GaveKal. Note that registration is required but they will only send you the weekly ‘Virtual Advisor’.

Chart of 10 year apartment building investment loan rates

About the spread between the T10 and the apartment building rate we track, Continue reading 10yr Apartment Investment Loan Rate Steady While ULI <60LTV Rate Drifts Lower

Apartment Building Investment Still Leads as CRE Prices Up 11% YoY in CoStar’s Repeat Sales Indexes

CoStar is out with their latest Commercial Repeat Sale Indices (CCRSI) showing that:

  • Commercial Real Estate prices post double-digit annual gains in May
  • Momentum picks up in the General Commercial segment
  • Improvements in market fundamentals underpin growth in commercial property pricing
  • Capital flows remain healthy
  • Distress levels continue to dissipate
  • See link for numbers and details-

Commercial Real Estate Up 11% YoY in May 2014

CoStar has been tracking the indexes of repeat commercial real estate sales since 1996. Note that the Value Weighted index is driven mostly by core properties while the Equal Weighted index is mostly driven by smaller, non-core property sales.

For apartment building investors the good news is that Continue reading Apartment Building Investment Still Leads as CRE Prices Up 11% YoY in CoStar’s Repeat Sales Indexes

Apartment Investment Loan Rates Remain in 4.6-4.7% Range As Spread To Treasury 10yr Holds

The apartment building loan rate we track came in today at 4.765% (see below for loan details), making it 22 straight weeks below the five percent mark. The spread to the 10 year Treasury (T10) also remained in the 2.1 and change range where it’s been since the beginning of March, indicating that the very competitive market for multifamily loans continues on.

For the gold plated ULI less than 60% LTV loan the spread dropped into the 1.2s from the 1.3 range where it had been holding since late February, taking the implied rate for these core institutional apartment loans down to 3.77%.

10 Year Treasury versus Apartment Building Investment Loan Rate

Speaking of the spread between the T10 and the Continue reading Apartment Investment Loan Rates Remain in 4.6-4.7% Range As Spread To Treasury 10yr Holds

Apartment Building Investment Rocks Q2 across the US (video)

That happy feet sound you hear is coming from apartment building investors as they see their results from the second quarter:

  • Rents Up
  • Vacancy Down
  • New Supply Being Absorbed as soon and it’s built

Here’s the video report from MPF Research:

And it’s not just the usual Continue reading Apartment Building Investment Rocks Q2 across the US (video)

Rates For Apartment Building Loans About Where They Were A Year Ago Just Before…

The apartment loan rate we track popped up into the 4.70s today after spending the last three weeks in the 4.60s. Today’s 4.71% rate is about the same as it was a year ago, just before the taper tantrum hit. Monday quotes on the 10 year Treasury have climbed two weeks in a row now but remain below most recent highs of March, clocking in at 2.62 today. The downward march of the spread has flattened recently in the 2.0 – 2.15 range, including today’s number at 2.14. The ULI <60%LTV rate still looks like someone bouncing a ball down the stairs but their data is lagged a week so we’ll have to check back on Friday to see if that rate is going to tick up as well.

10 year Treasury versus Apartment Building Investment Loan Rete June 2014
Click on image for full size

Speaking of the spread between the T10 and the ten year apartment loan rate, now that Continue reading Rates For Apartment Building Loans About Where They Were A Year Ago Just Before…

Apartment Building Investment Loan Rate Trends Lower as 10yr Treasury and Spread Fall.

The apartment building investment loan rate we track continued to trend downward as both the 10yr Treasury (T10) and the spread between the two came in during April. Today’s new rate on the loan is 4.733%, a 212 basis point spread over the T10 which was in the  2.61% area today. The six month moving average spread continues to fall suggesting that lenders are more confident and/or aggressive but the spread itself is above the March 17 low of 209bp.

This month we add a new rate which the ULI (Urban Land Institute) reports on from the Trepp survey. According to the ULI the Trepp rate is what large institutional borrowers could expect to pay on a 10 year fixed rate, less than 60% LTV loan for a “crème de la crème” core apartment property located in a gateway market. We track this rate as a barometer of what the largest lenders are offering their best customers on the most secure loans for any advanced warning about future rate and spread changes.  See the ULI<60LTV Rate on the chart below (in gold). Note that the spread we chart is between 10yr loan we track (in orange) and the T10 (in blue):

Apartment Building Investment Loan Rate versus Ten Year Treasury Rate May 2014

Speaking of the spread between the T10 and the ten year apartment loan rate, now that Continue reading Apartment Building Investment Loan Rate Trends Lower as 10yr Treasury and Spread Fall.