The apartment loan rate we track popped up into the 4.70s today after spending the last three weeks in the 4.60s. Today’s 4.71% rate is about the same as it was a year ago, just before the taper tantrum hit. Monday quotes on the 10 year Treasury have climbed two weeks in a row now but remain below most recent highs of March, clocking in at 2.62 today. The downward march of the spread has flattened recently in the 2.0 – 2.15 range, including today’s number at 2.14. The ULI <60%LTV rate still looks like someone bouncing a ball down the stairs but their data is lagged a week so we’ll have to check back on Friday to see if that rate is going to tick up as well.
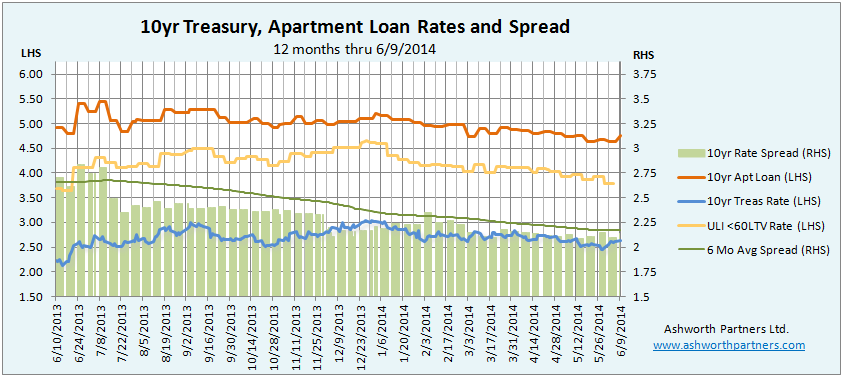
Speaking of the spread between the T10 and the ten year apartment loan rate, now that we have more than a year’s worth of data we’ve improved the charting of the average spread to be a six month moving average rather than a flat one year average. Because the rate data we reference is reported on business days only we are averaging the previous 120 business days which works out to roughly six months. Some time in June the spread average visible on the chart will be a complete moving average. Until then, for dates before last June the chart shows the year to date average. Also updates on our chart going forward will track the trailing twelve months data.
We track the 10 year Treasury because that is the benchmark most lenders base their long term rates on. In order to lure investors away from Treasuries to buy mortgage bonds lenders have to offer a premium (AKA ‘spread’) over what can be earned on the Treasury. So when the T10 moves, rates on all kinds of longer term loans including on apartments tend to move also. As you can see in the chart, the spread also widens and narrows as market forces make an impact.
Notes about the apartment loan rates shown in the chart above: The rates shown here are from one West Coast regional lender for loans on existing apartment buildings between $2.5 – 5.0M. The rate quote they send every Monday that I track is a 30 year amortizing loan with a fixed rate for 10 years (They also have other fixed periods at different rates). The max LTV for this loan is 75% (they have an even lower rate on their max 60LTV loans) and the minimum Debt Cover Ratio (DCR, aka DSR or DSCR) is 120. Note too that these are ‘sticker’ rates, LTVs and DCRs and ‘your millage may vary’ depending on how their underwriting develops. I usually figure that we’ll end up at a 70LTV which also helps the debt cover and provides a larger margin of safety, which is half the battle from a value investing standpoint.
The prepay fee is 5,4,3,2,1% for early repayment in the first five years and you do have the ability to get a 90 day rate lock. The minimum loan is $500k (at a slightly higher rate for less than $1M loans) and they’re pretty good to work with as long as you go in knowing that it takes up to 60 days to close their loan. If you are looking at acquiring an apartment building in California, Oregon or Washington I’d be happy to recommend you to my guy there for a quote. Send me a message through this link and I’ll make an introduction for you.
The other rate we track is the from the Trepp survey which the ULI (Urban Land Institute) reports on. According to the ULI the Trepp rate is what large institutional borrowers could expect to pay on a 10 year fixed rate, less than 60% LTV loan for a “crème de la crème” core property located in a gateway market. We track this rate as a barometer of what the largest lenders are offering their best customers on the most secure loans for any advanced warning about future rate and spread changes. Note that the spread we chart is between 10yr loan we track and the T10.
How the St. Louis Fed calculates the 10 year Treasury rate displayed above: “Treasury Yield Curve Rates. These rates are commonly referred to as “Constant Maturity Treasury” rates, or CMTs. Yields are interpolated by the Treasury from the daily yield curve. This curve, which relates the yield on a security to its time to maturity is based on the closing market bid yields on actively traded Treasury securities in the over-the-counter market. These market yields are calculated from composites of quotations obtained by the Federal Reserve Bank of New York. The yield values are read from the yield curve at fixed maturities, currently 1, 3 and 6 months and 1, 2, 3, 5, 7, 10, 20, and 30 years. This method provides a yield for a 10 year maturity, for example, even if no outstanding security has exactly 10 years remaining to maturity. For even more detail see: http://www.treasury.gov/resource-center/data-chart-center/interest-rates/Pages/yieldmethod.aspx
As a reminder, one basis point or 1bp is equal to one-one hundredth of one percent or .0001. When you hear ‘fifty basis points’ that’s one-half of one percent; ‘125bp’ would be 1.25% or a percent and a quarter, sometimes referred to as ‘a point and a quarter’. A bp seems like a tiny number, too fine to make a difference but in the debt world if you can squeak out an extra 20bp on a 100 million dollar deal (like a pool of apartment building loans) that’s $2oo,000.00 in your pocket. To paraphrase Everett Dirksen: “20bp here, 20bp there and pretty soon you’re talking about real money.”