3 Things I Learned Charting Apartment Building & Commercial Real Estate Market Cycles

Seattle’s Strange Trip Through the Apartment Building Investment Cycle Part II

In part I we saw that some of the most widely followed market cycle research can’t be relied on without question. If knowing where we are in the market cycle is the most important thing (and not everyone agrees, see the comments from one of my private equity guys about that under part I here) then the best solution is probably to chart the cycles for the markets we’re investing in ourselves. If you’re in multiple CRE sectors in a lot of markets hopefully you have someone on your team or can hire a consultant (like Ashworth) to chart those cycles.
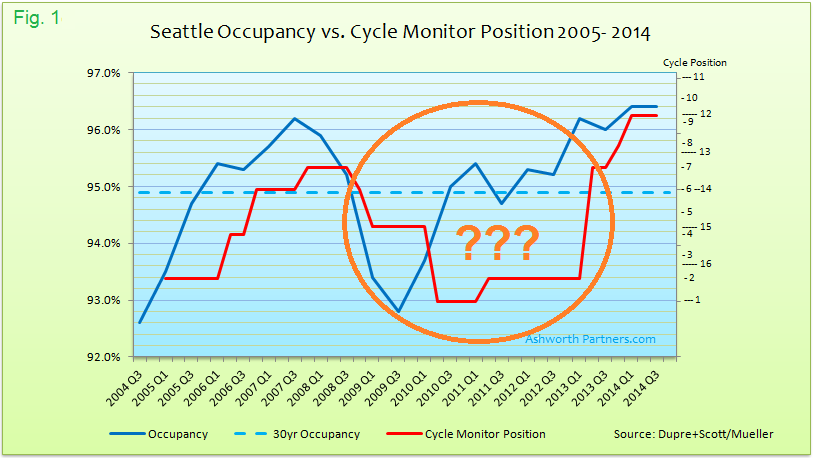
SEA occupancy v cycle position WTH
Click on images for full size.

Building our own CRE market cycle chart

To track a cycle for one market and sector we only need to answer five questions according to Professor Mueller’s methodology: Market occupancy, the 30 year Long Term Average (LTA) occupancy, rent growth, inflation and new unit construction. Later we’ll look at whether we can Continue reading 3 Things I Learned Charting Apartment Building & Commercial Real Estate Market Cycles
Widely Followed Apartment Market Cycle Research Misses Widely

The Strange Tale of the Seattle Apartment Building Investment Cycle and Maybe Yours Too.

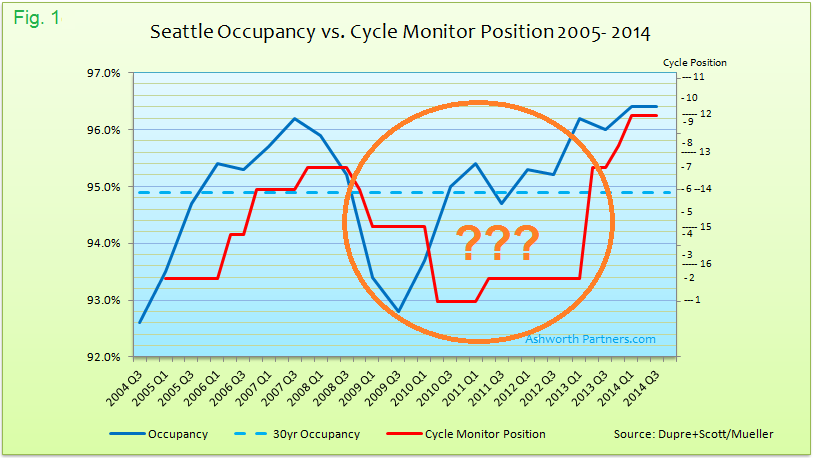
Back in 2012 it appeared that Seattle’s movement through the real estate cycle was stalling out. Not the actual market by any stretch of the imagination but instead where it was placed on the apartment market cycle charts in the Cycle Monitor report from Dividend Capital Research. These quarterly reports on the real estate market cycles for the five main Commercial Real Estate (CRE) sectors in more than fifty markets around the US were widely followed but something was wrong.

Seattle apartment occupancy vs. Cycle Monitor Market Position 2005 - 2014
Click on images for full size.

Why this up to date market data is vitally important to your investment success:

You can fix a property but not a market cycle. Knowing where a market is in its cycle is critical for investors seeking to buy low and sell high. If signals are a year or more behind, prime opportunities will be missed to Continue reading Widely Followed Apartment Market Cycle Research Misses Widely

Apartment Building Investment Rocks Q2 across the US (video)

That happy feet sound you hear is coming from apartment building investors as they see their results from the second quarter:

  • Rents Up
  • Vacancy Down
  • New Supply Being Absorbed as soon and it’s built

Here’s the video report from MPF Research:

And it’s not just the usual Continue reading Apartment Building Investment Rocks Q2 across the US (video)

The ‘Twin Peaks’ of Seattle Apartment Building Investment Plus MPF Research says rent growth holding strong there.

Friday twofer on Seattle. First is Dupre+Scott’s  entertaining and enlightening video on apartment building construction and property sales:

Mike has two nice charts showing apartment development numbers back to 1988 and sales volume back to 1981. Note that on the sales volume chart 2013 numbers are Continue reading The ‘Twin Peaks’ of Seattle Apartment Building Investment Plus MPF Research says rent growth holding strong there.

Local Apartment Building Investment Research Reports For 37 US Cities Now Posted by Marcus & Millichap

Requires (free) registration: M&M Research

Here’s a peek at their Phoenix Charts:

Phoenix Apartment Building Rent Trends Q2 2013

Phoenix Apartment Building Vacancy Q2 2013

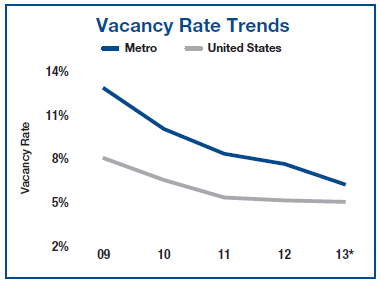
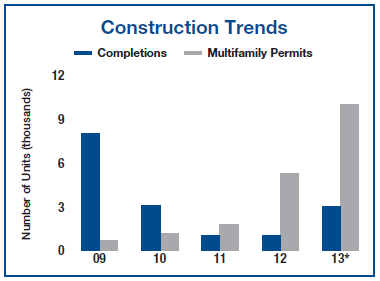
Phoenix Apartment Building Construction Q2 2013 Continue reading Local Apartment Building Investment Research Reports For 37 US Cities Now Posted by Marcus & Millichap

Apartment Building Investment Cycle Analysis via Dividend Capital. Can this be right?

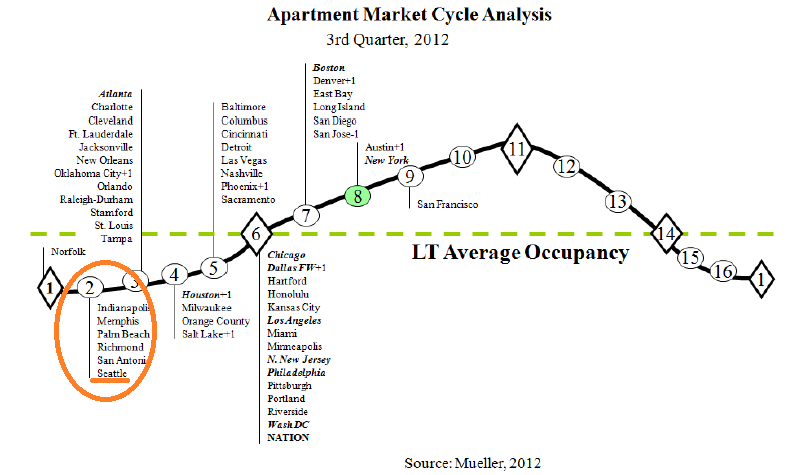
Dividend Capital’s Q3 Market Cycle Monitor Report is out and naturally I looked at the apartment building investment cycle chart first. Specifically these days I’m looking to see where the author, Glenn R. Mueller Ph.D. has placed the Seattle market in the cycle.

US Q3 apartment building investment cycle analysis from Dividend Capital

In this latest report you can see that it is listed at position 2 with only Norfolk listed lower at position 1. What does position 2 signify? According to the good Doctor, position 2 lies in the Phase 1 – Recovery Quadrant defined as having “No New Construction” and position 2 specifically having “Negative Rental Growth”. But how can this be? Continue reading Apartment Building Investment Cycle Analysis via Dividend Capital. Can this be right?

Risks to Apartment Overbuilding Averted, For Now says ReisReports

In a piece just out today ReisReports says that new apartment starts have been postponed to 2014 by many developers.

The “bubble” now shows up in 2014, but if economic growth ramps up, then additional supply will most likely be absorbed relatively painlessly.

But not all Metros escape. The report mentions Washington DC and suburban Maryland as two of those who will still see large increases in supply next year.

US Apartment Market moves big supply increase to 2014

Interestingly they name Seattle as a market that should be able to absorb the new supply coming because Continue reading Risks to Apartment Overbuilding Averted, For Now says ReisReports

Portland apartment building investment market grows stronger.

Joe Chaplik at Joseph Bernard Investment Real Estate sent me a summary of apartment building investment transactions for Q3 in the Portland area and surrounding counties:

  • Transactions in Q3: 39, including 27 in Multnomah County (Portland is the County seat)
  • Transactions YTD: 114, averaging 38 per quarter.
  • Total transaction volume Q3: $164,115,807
  • Total units in Q3 transactions: 1,385
  • Average price per unit Q3 in Multnomah Co: $100,794; up 49% from year ago.
  • Q3 average cap rate: 6.32, up from 6.24 last quarter.
  • 80% of the transactions in Q3 were properties with less than 50 units.
  • See the whole report here.
Portland apartment builidng investment market grows
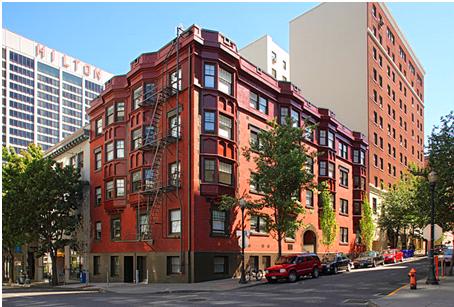
Admiral Apartments, 37 units, 910 SW Park Ave, Portland, OR

With cap rates 100 basis points higher than Continue reading Portland apartment building investment market grows stronger.

Apartment Building Occupancy, Effective Rents and Revenues Charted. How are yours?

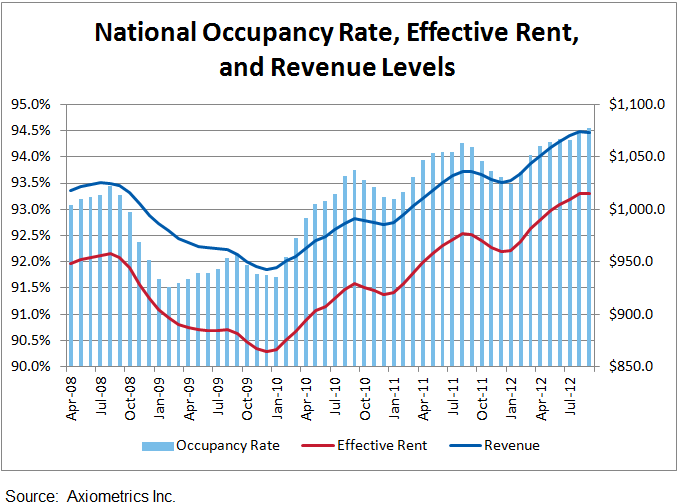
Axiometrics was out with their National Monthly Apartment Trends report which includes a couple of cool charts, one is a map of their top 88 markets coded by rent growth (below). The one that caught my eye though was showing Occupancy, Effective Rents and Revenues:

Apartment Building Investment Occupancy, Effective Rents and Revenue

From the chart it looks like the national average of Continue reading Apartment Building Occupancy, Effective Rents and Revenues Charted. How are yours?

Class C Apartment Building Investments takes the lead in rent growth nationally says Axiometrics.

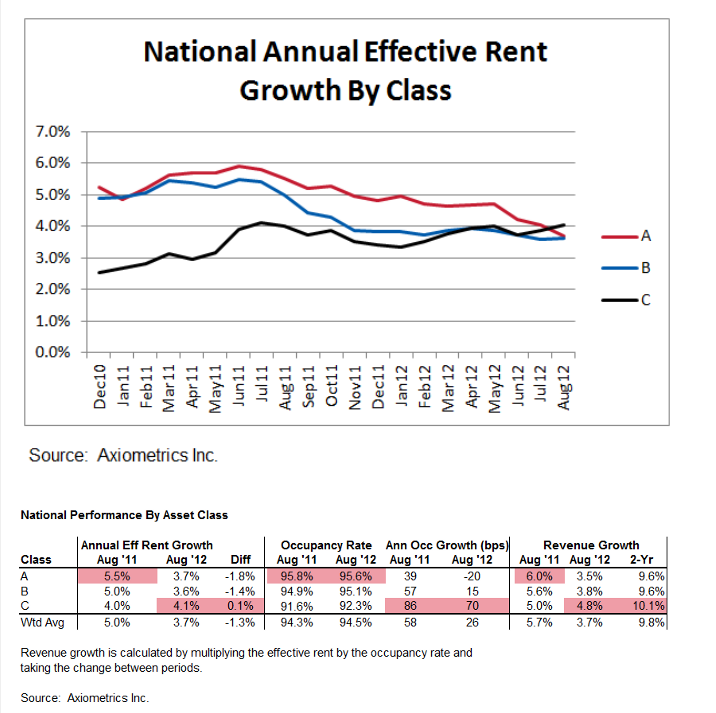
From their latest National Monthly Trends report: Class C properties took the lead for annual effective rent growth in August. Class A properties had been the leader in that category as the apartment market improved over the past few years, but the Class A annual growth rate slowed from 4.73% in May to 3.70% in August. Why has the growth rate slowed so much in just the past few months? Is it tied to job growth, which weakened in May? Is the first wave of new supply starting to impact performance as we show new apartment deliveries nationally jumping from about 13,000 in the first quarter to over 17,000 in the second quarter and 25,000 in the third quarter? Or is it simply because a $75 increase this year is not as big of a relative change as it was a year ago since the denominator in the rent growth equation keeps getting larger? The answer is likely due partially to all three situations, but the weighting of each factor can vary by market. However, new supply could play an even larger role next year than it will this year.

Class C Aparment Building Investment rents are outgrowing other classes

See the whole report with more charts and data here Continue reading Class C Apartment Building Investments takes the lead in rent growth nationally says Axiometrics.