Friday twofer on Seattle. First is Dupre+Scott’s entertaining and enlightening video on apartment building construction and property sales:
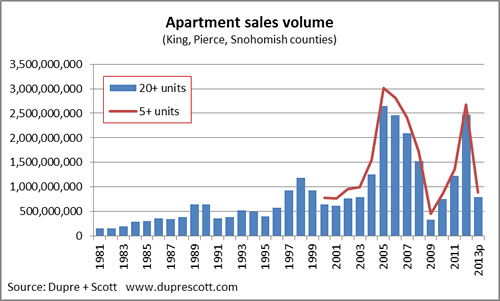
Mike has two nice charts showing apartment development numbers back to 1988 and sales volume back to 1981. Note that on the sales volume chart 2013 numbers are YTD, on the video he shows that number annualized. When he talks about total sales he seems to quote the 20+ unit number and just to double check I asked with him to clarify. He said that the 5+ unit sales number includes the 20+ so the red line on the chart is the total. Dupre+Scott’s research data is usually split into 5-20 unit and 20+ unit and I missed that the legend said 5+ units, so it was clear if you’re paying attention at least. 😳

See the other Twin Peaks chart and the rest of the article here: Watching Twin Peaks
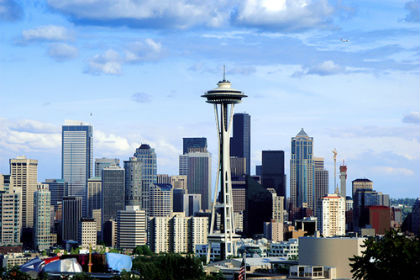
Greg Willett over at MPF Research put out a report on Seattle apartment building investment results Wednesday which included a nice photo of the city on a rare non-rainy day:
Even better than sunshine in Seattle is the fact that in spite of all the new supply coming online, absorption and rent growth are still strong:
- Effective rents for new leases in the Seattle/Tacoma apartment market jumped 2.0% during 1Q 2013, taking the annual pace of growth to 4.2%.
- Compared to other metros across the country, the Puget Sound area is continuing to sustain some impressive pricing power.
- Tight occupancy – the stock was 95.7% full as of 1st quarter – certainly plays a role in the upward path of rents.
- Seattle apartment demand came in at some 1,700 units specifically in 1Q and about 7,400 units in the year-ending 1Q.
- Nationally, only Dallas/Fort Worth and Houston experienced stronger product absorption during the past year.
Greg expects that rent growth in Seattle will cool off a bit moving forward but remain above the national average.
