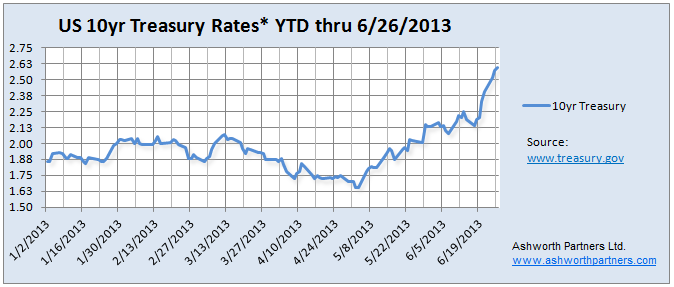
In the Analysis on Tapering QE3 post Tuesday I included a chart of the US 10 year Treasury rates and you could see them going vertical in the days since the Fed announcement and Bernanke’s press conference last week. We’re in the middle of negotiations on an apartment acquisition with a client and so what interest rates do over the next few days and weeks is extremely important to us. So here’s the updated chart:

We concentrate on the 10 year Treasury because that is the benchmark most lenders base their long term rates on. In order to lure investors away from Treasuries to buy mortgage bonds lenders have to Continue reading Update on the 10yr Treasury rate which drives Multifamily, Commercial Real Estate and Home loan rates.