10yr Apartment Building Loan Rate Back On It’s Meds at 4.375%

10 year apartment building investment loan rates
Click on image for full size.

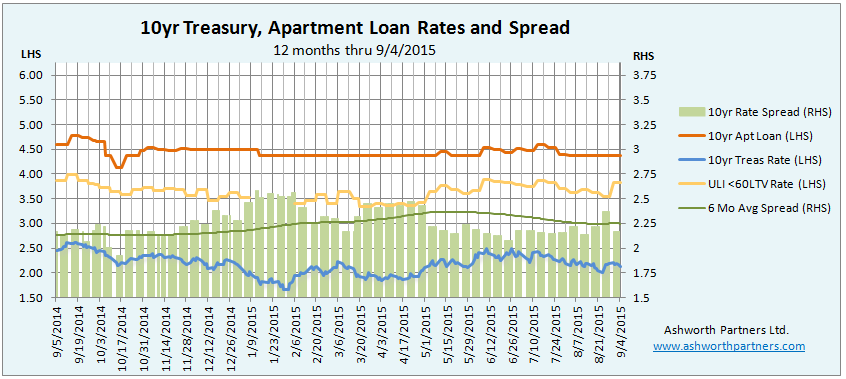
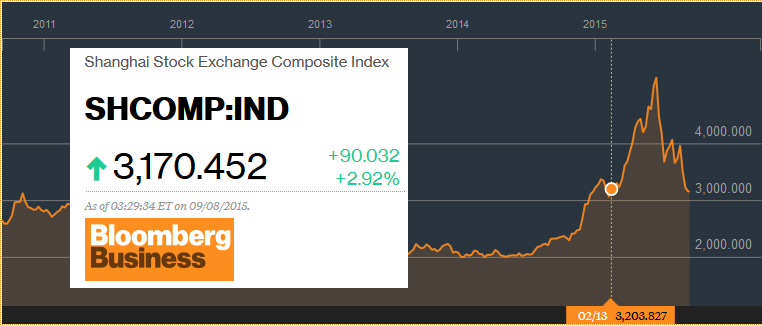
After showing signs of life in June and July the 10yr apartment building investment loan rate we track seems to be fully anesthetized once again and is resting comfortably at 4.375%. Meanwhile the ULI rate seemed to be steadily working its way lower, following the ten year Treasury down which got as low as 2.01%. That all ended with the Chinese stock market melt down and currency devaluation a couple weeks ago and drove the ULI rate up 27bp to 3.82%.

Chinese stock market has only fallen back to where it was in February
Click on image for full size.

Interestingly despite all the panic about the Continue reading 10yr Apartment Building Loan Rate Back On It’s Meds at 4.375%

Treasury rates are up but…

10 year Treasury rates vs. apartment builiding investment loan rates thru July 2015
Click on image for full size

For this month’s post on apartment building investment loan rates and the key 10yr Treasury (T10) we’re looking at the longer trend back to the beginning of 2013. The news has been full of talk about rising interest rates but looking at the chart above we can see that while the T10 is up off its recent low of 1.68% in the end of January it’s still more than 50 basis points below the highs it hit in September and December 2013 (2.98% and 3.04% respectively).

In turn the 10 year apartment loan we track has been treading water around the 4.3% mark for the last nine months and essentially it’s back to where it was in early 2013 before the Continue reading Treasury rates are up but…

UPDATED: The Apartment Market Cycle Peak Is Here, It’s Just Not Evenly Distributed Yet

Apartment Building Investment Cycle with Expanded Peak
How I Learned to Stop Worrying and Love The… Low Cap Rates. Click on image for full size.

Was quoted in a Multifamily Executive piece this week by Joe Bousquin Cap Rate Limbo: How Low Can They Go? discussing where we are in the apartment building investment cycle, whether multifamily cap rates could go any lower and how do you make a deal pencil in this environment. It’s a good quick read with apartment pros from around the country sharing their thoughts on how things stand. I really got a kick out of the Barbara Gaffen’s story about a Chicago property trading for $651,000 a unit.

Here are the rest of my comments:

The market cycle peak is here, it’s just not evenly distributed. Cycle tops (in the absence of a financial meltdown) tend to be rounded and therefore very hard to call. We’re focused Continue reading UPDATED: The Apartment Market Cycle Peak Is Here, It’s Just Not Evenly Distributed Yet

Spreads Widen on 10 Year Apartment Investment Loan Rate, Trend or Seasonal?

The 10 year apartment building investment loan rate we track has returned to its old boundary of four and a half percent despite Treasuries in the two and teens again at the end of November. On the 28th the T10 was within 1pb of the mid-October Massacre low of 2.17. Something had to give for the loan rate to get back to the 4.5% range and it was the spread which jumped above 2.25 last week for the first time since February:

Apartment Building Investment Loan Rates vs Treasuries Yield Premium

The spread has gone from the Massacre low of 1.93 to 2.28, a 35bp climb in only seven weeks. Meanwhile the ULI <60%LTV last week was 3bps below its mid-October low, tracking the Treasury with a consistent spread of 1.38 in four of the last five weeks.

It’s interesting that the spread plunged Continue reading Spreads Widen on 10 Year Apartment Investment Loan Rate, Trend or Seasonal?

Update on the 10yr Treasury rate which drives Multifamily, Commercial Real Estate and Home loan rates.

In the Analysis on Tapering QE3 post Tuesday I included a chart of the US 10 year Treasury rates and you could see them going vertical in the days since the Fed announcement and Bernanke’s press conference last week. We’re in the middle of negotiations on an apartment acquisition with a client and so what interest rates do over the next few days and weeks is extremely important to us. So here’s the updated chart:

10 year Treasury rate chart YTD 2013
Click for full size image. *Treasury Yield Curve Rates, commonly referred to as “Constant Maturity Treasury” rates, or CMTs. This method provides a yield for a 10 year maturity even if no outstanding security has exactly 10 years remaining to maturity. More at www.treasury.gov

We concentrate on the 10 year Treasury because that is the benchmark most lenders base their long term rates on. In order to lure investors away from Treasuries to buy mortgage bonds lenders have to Continue reading Update on the 10yr Treasury rate which drives Multifamily, Commercial Real Estate and Home loan rates.

The shape of the entire yield curve drives #CRE pricing, not single Treasury rate- CBRE Econometrics

Research out from CBRE Econometric Advisors shows that the typical risk-free benchmark rate, the 10 year Treasury, does not accurately reflect the cost of capital risks in asset pricing for commercial real estate. The whole yield curve or ‘term structure’ should be used instead. Highlights from their report:

  • Our research shows that it is not a single risk-free rate that drives asset pricing, but rather the entire term structure of interest rates (also referred to as the shape of the yield curve; we use these terms interchangeably). This term structure effect is so strong that relying upon a single benchmark rate in one’s analysis (as is typically done by analysts and investors) is inappropriate. We will demonstrate this below, using our empirical model of cap rates.

Cap Rates vs Yield Curve for Capartment building investment pricing