
For this month’s post on apartment building investment loan rates and the key 10yr Treasury (T10) we’re looking at the longer trend back to the beginning of 2013. The news has been full of talk about rising interest rates but looking at the chart above we can see that while the T10 is up off its recent low of 1.68% in the end of January it’s still more than 50 basis points below the highs it hit in September and December 2013 (2.98% and 3.04% respectively).
In turn the 10 year apartment loan we track has been treading water around the 4.3% mark for the last nine months and essentially it’s back to where it was in early 2013 before the ‘Taper Tantrum’ hit. We can also see that spreads between the T10 and the apartment rate have come in 40 basis points or so since 2013.
The ULI rate we track from Trepp (see below for details on the loans we track) with its much tighter spread to the T10 has been ratcheting up lately too but is only about 20bp higher than it was at the beginning of 2013.
The fifteen year (term and amortization) loan we track moved up 5 basis points to 4.55% this week but for long term holders who have the cash flow to support the higher debt service this still looks like an attractive rate. Plus the building will be paid off just before some of those larger CapEx items crop up.
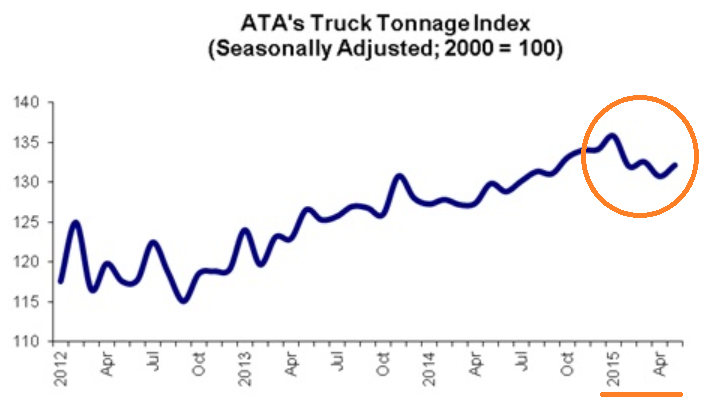
Every talking head in the financial mediaverse has been talking about the impending interest rate rise from the Fed but as I’ve written about previously (here and here for instance) it’s more likely that the Fed will continue to find one data point after another that shows the real economy isn’t doing nearly as well as the Wall St. ‘economy’ (See the amount of goods shipped by truck in the US declining since early this year in the chart below). The Fed would like to raise rates just to prove that we aren’t turning Japanese but there’s a new reason not to showing every other week or so.
Lately it’s been Greece and most recently it’s been the crashing Chinese stock market. Next week or the week after something else will arise because the everyday go to work, build something and get someone else to pay for the value you created world just isn’t doing that well. It’s worth noting however that in the larger scheme of things China is a much bigger potential issue than Greece; China is the world’s second largest economy and there are twenty Chinese cities with a larger GDP than the entire country of Greece.
Another interesting point is that the SSE Composite Index has only ‘crashed’ back to the level it was at in late March just three months ago so these are very short term gains & losses (See the chart here). Yes it still hurts but don’t believe the media narrative about ‘all’ the luckless mom & pops being wiped out of their highly leveraged positions, only 11% of Chinese households own any stock at all and two thirds of Chinese stock market participants hold only 5% of the total market value.
An interesting question is whether Chinese real estate investors will invest more or less property abroad as a result of the ‘crash’. My crystal ball is in for warranty service so I’d really appreciate sharing your thoughts in the comments below.
Speaking of the spread between the T10 and the apartment building rate we track, the green line on the chart represents the six months trailing average spread. We track changes in the trend for signs apartment lenders becoming more or less competitive. Note that since rates are only quoted on business days the chart averages the last 120 business days which roughly equates to six calendar months.
We track the 10 year Treasury (T10) because that is the benchmark most lenders base their long term rates on. In order to lure investors away from Treasuries to buy mortgage bonds lenders have to offer a premium (AKA ‘spread’) over what can be earned on the ‘risk free’ Treasury. So when the T10 moves, rates on all kinds of longer term loans including on apartments tend to move also. As you can see in the chart, the spread also widens and narrows as market forces make an impact.
Notes about the apartment loan rates shown in the chart above: The rates shown here are from one West Coast regional lender for loans on existing apartment buildings between $2.5 – 5.0M. The rate quote they send every Monday that I track is a 30 year amortizing loan with a fixed rate for 10 years (They also have other fixed periods at different rates). The max LTV for this loan is 75% (they have an even lower rate on their max 60LTV loans) and the minimum Debt Cover Ratio (DCR, aka DSR or DSCR) is 120. Note too that these are ‘sticker’ rates, LTVs and DCRs and ‘your millage may vary’ depending on how their underwriting develops. I usually figure that we’ll end up at a 70LTV which also helps the debt cover and provides a larger margin of safety, which is half the battle from a value investing standpoint.
The prepay fee is 5,4,3,2,1% for early repayment in the first five years and you do have the ability to get a 90 day rate lock. The minimum loan is $500k (at a slightly higher rate for less than $1M loans) and they’re pretty good to work with as long as you go in knowing that it takes up to 60 days to close their loan. If you are looking at acquiring an apartment building in California, Oregon or Washington I’d be happy to recommend you to my guy there for a quote. Send me a message through this link and I’ll make an introduction for you.
The other rate we track is the from the Trepp survey which the ULI (Urban Land Institute) reports on. According to the ULI the Trepp rate is what large institutional borrowers could expect to pay on a 10 year fixed rate, less than 60% LTV loan for a “crème de la crème” core property located in a gateway market. We track this rate as a barometer of what the largest lenders are offering their best customers on the most secure loans for any advanced warning about future rate changes. Note that the spread we chart is between 10yr loan we track and the T10.
How the St. Louis Fed calculates the 10 year Treasury rate displayed above: “Treasury Yield Curve Rates. These rates are commonly referred to as “Constant Maturity Treasury” rates, or CMTs. Yields are interpolated by the Treasury from the daily yield curve. This curve, which relates the yield on a security to its time to maturity is based on the closing market bid yields on actively traded Treasury securities in the over-the-counter market. These market yields are calculated from composites of quotations obtained by the Federal Reserve Bank of New York. The yield values are read from the yield curve at fixed maturities, currently 1, 3 and 6 months and 1, 2, 3, 5, 7, 10, 20, and 30 years. This method provides a yield for a 10 year maturity, for example, even if no outstanding security has exactly 10 years remaining to maturity. For even more detail see: http://www.treasury.gov/resource-center/data-chart-center/interest-rates/Pages/yieldmethod.aspx
As a reminder, one basis point or 1bp is equal to one-one hundredth of one percent or .0001. When you hear ‘fifty basis points’ that’s one-half of one percent; ‘125bp’ would be 1.25% or a percent and a quarter, sometimes referred to as ‘a point and a quarter’. A bp seems like a tiny number, too fine to make a difference but in the debt world if you can squeak out an extra 20bp on a 100 million dollar deal (like a pool of apartment building loans) that’s $200,000.00 in your pocket. To paraphrase Everett Dirksen: 20bp here, 20bp there and pretty soon you’re talking about real money. If you did that every week for a year that would be $10,000,000 and you’d still have two weeks for vacation!