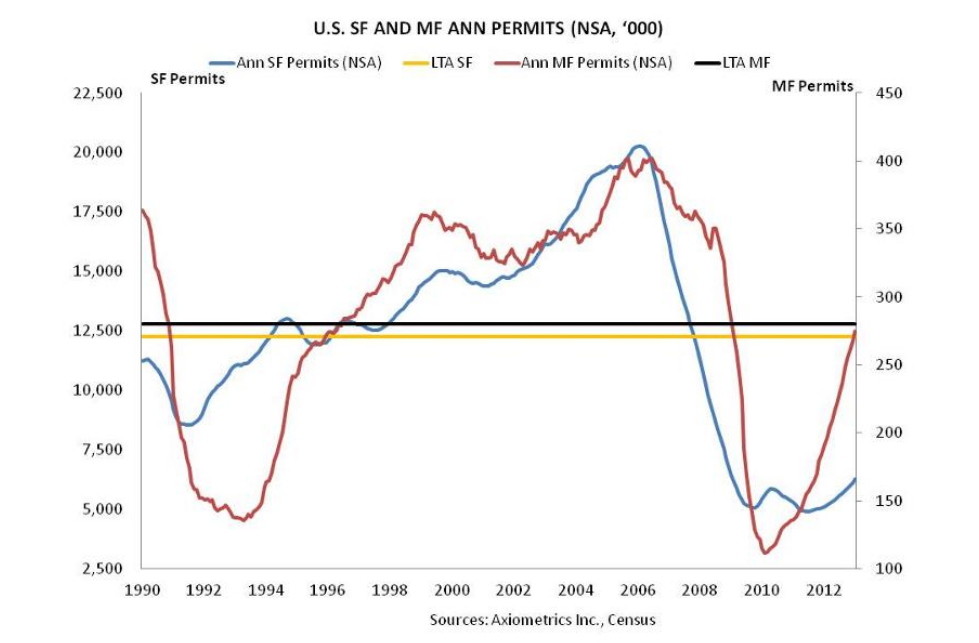
In their latest apartment building permitting report Axiometrics says: “permitting increased 44.3% or 84,308 units from the January 2012 figure of 274,640 units.” This is very near the long term average of 280,000 units, see the chart:
The Mortgage Bankers Association is out today with a white paper “Ensuring Liquidity And Stability: The Future Of Multifamily Housing Finance And The Government-Sponsored Enterprises“. (or see the MHN exec sum here) The paper highlights the role of the GSEs (Government Sponsored Enterprises, i.e. FNMA ‘Fannie Mae’ and FHLMC ‘Freddie Mac’) in today’s multifamily finance market and presents five recommendations for the future making their points with a set of charts that demonstrate the size of their role in multifamily as well as the very low amount of bad loans they’ve made in the sector.
Our nation’s housing policies should reflect the importance of multifamily rental housing, the range of capital sources that support this market, and the need for liquidity and stability in all market cycles.
The NAHB was out with their weekly Eye on Housing report and this week’s edition took a look at the Q3 SOMA data from the Census Bureau. SOMA stands for Survey of Market Absorption of Apartments and overall things are looking pretty positive for developers. One interesting chart they had showed the types of properties that were being built since 2005:
Dividend Capital’s Q3 Market Cycle Monitor Report is out and naturally I looked at the apartment building investment cycle chart first. Specifically these days I’m looking to see where the author, Glenn R. Mueller Ph.D. has placed the Seattle market in the cycle.
In this latest report you can see that it is listed at position 2 with only Norfolk listed lower at position 1. What does position 2 signify? According to the good Doctor, position 2 lies in the Phase 1 – Recovery Quadrant defined as having “No New Construction” and position 2 specifically having “Negative Rental Growth”. But how can this be? Continue reading Apartment Building Investment Cycle Analysis via Dividend Capital. Can this be right?
The NAHB is out this morning with a chart that gives some perspective on apartment building investment starts. The Census Bureau reported 285,000 unit starts in October for 5+ unit buildings. At that rate it looks like we’re just returning to what was a sustainable level of starts in the ’97-’06 period.
The “bubble” now shows up in 2014, but if economic growth ramps up, then additional supply will most likely be absorbed relatively painlessly.
But not all Metros escape. The report mentions Washington DC and suburban Maryland as two of those who will still see large increases in supply next year.
Very nice piece from Joseph Y. Calhoun over at Alhambra Investment Partners covering some of the unexpected good things that could happen to our economy entitled Looking For Silver Linings. He includes this nugget with its implication of a good apartment building investment climate continuing:
In the ten years prior to the recession, household formation averaged 1.5 million per year. From 2007 to 2010 that rate was cut by 2/3. Household formation recovered to a bit over 1 million in 2011 and probably rose more this year. Still there is a gap of about 2.5 million households between the number formed in that period and what would be expected based on demographic trends. There is pent up demand for housing (although probably primarily rental housing) that only awaits some job growth to be realized. [Emphasis mine]
Axiometrics’ monthly apartment building investment report has a great chart showing the seasonal effects on effective rent, occupancy rate and revenue growth. How do you model seasonality in your budgets? What do you think is the best way to do this?
Tom Barrack of Colony Capital on what’s really happening in US real estate from an investor’s perspective. The clearest, most cogent look at the state of commercial, multifamily and single family markets today and where the opportunities are. The first five and a half minutes is about Europe and the bottom line there is don’t but after that it is all gold. If Tom wanted to be one of those real estate ‘gurus’ he could package this video with a big notebook and some advertising and sell it for $10,000- and it would be better than any of the other stuff out there. And you get it for free. I’ve watched three times and get an extra little nugget each time.