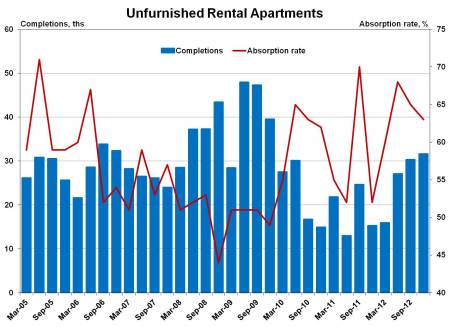
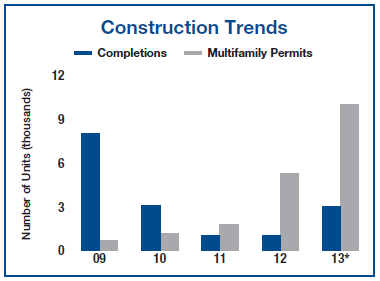
The NAHB (National Association of Home Builders) Eye on Housing out late last week included a chart of 5+ unit apartment building construction and absorption in the US. Built with the latest data from the Census Bureau’s SOMA (Survey of Market Absorption of Apartments, xls available here) is shows that absorption is holding in around 65% even while construction of new units is picking up:
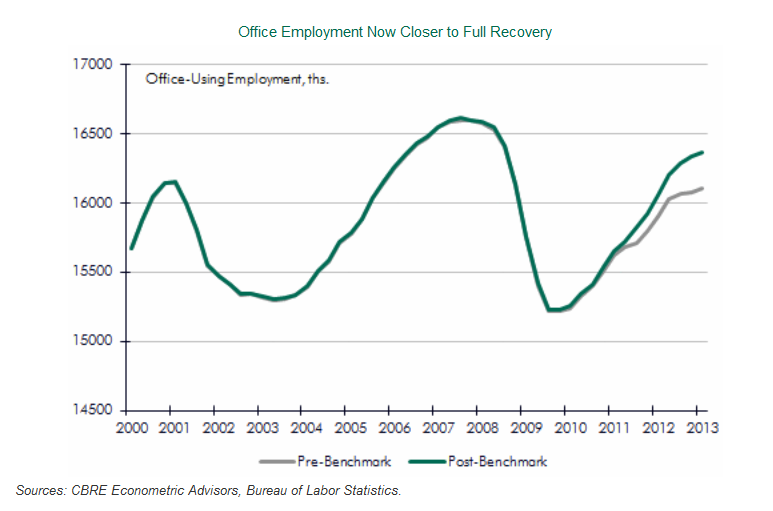
Interesting report from CBRE Econometric Advisors on the revised employment numbers just out from the Bureau of Labor Statistics’ (BLS). The BLS updates their employment numbers every year to reduce the error rate from their regular surveys and the revisions were up:
Click for full size image.
It is important to understand that the employment data produced by the BLS are based on a survey and therefore are subject to sampling error. As part of its survey methodology, the BLS completes a re-benchmarking of its payroll employment data annually, to account for any job gains or losses that were missed over the course of the past year. The payroll survey consists of a sample of 145,000 businesses and government agencies covering 557,000 worksites throughout the U.S. The BLS uses a birth-death model to account for changes not directly reported in its sample due to business openings and closings.
In order to adjust for missing information that could cause the birth-death model to miss its mark, the BLS annually benches its estimates to unemployment compensation records, to allow for a reconciliation of total payroll employment. Although the largest changes are always seen in the most recent year or two, estimates as far back as five years may be measurably altered, which can have a significant effect on how the labor market is seen to have affected commercial real estate demand. The process is first done at the national level, and then at the state and local levels.
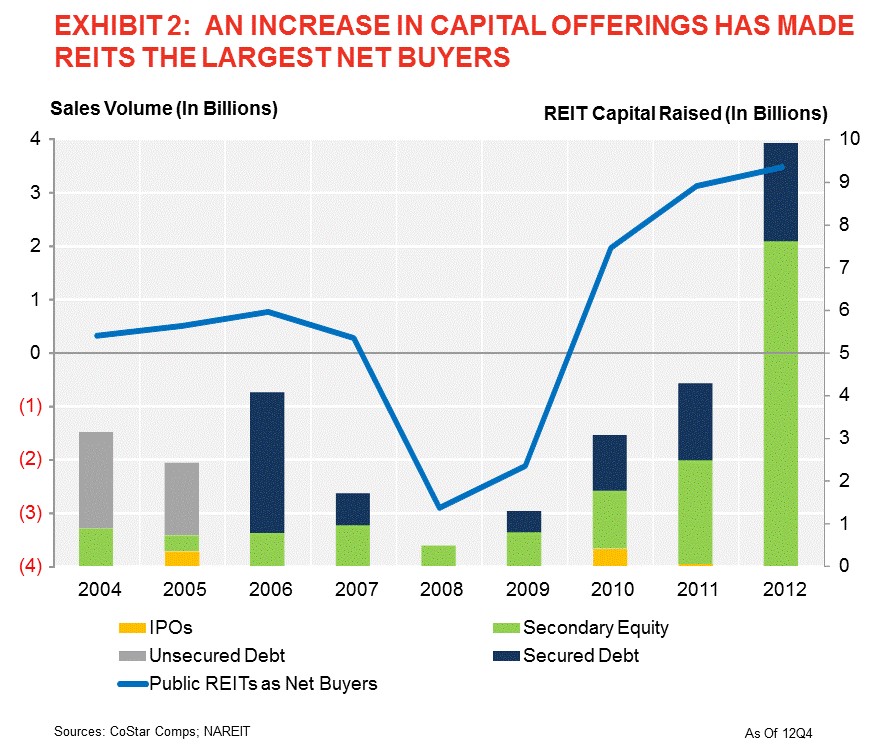
Mark Hickey of CoStar put out a piece looking at who was responsible for the near record $65.8B of apartment building investment in 2012. CoStar’s numbers show that private owners/developers did just about half of all acquisitions last year and institutions were in for 12%, both near their recent trends. REITs on the other hand increased their share by a third, responsible for 12% of sales volume last year.
Interestingly the sellers were pretty much the same groups, except REITs who were the largest net buyers last year.
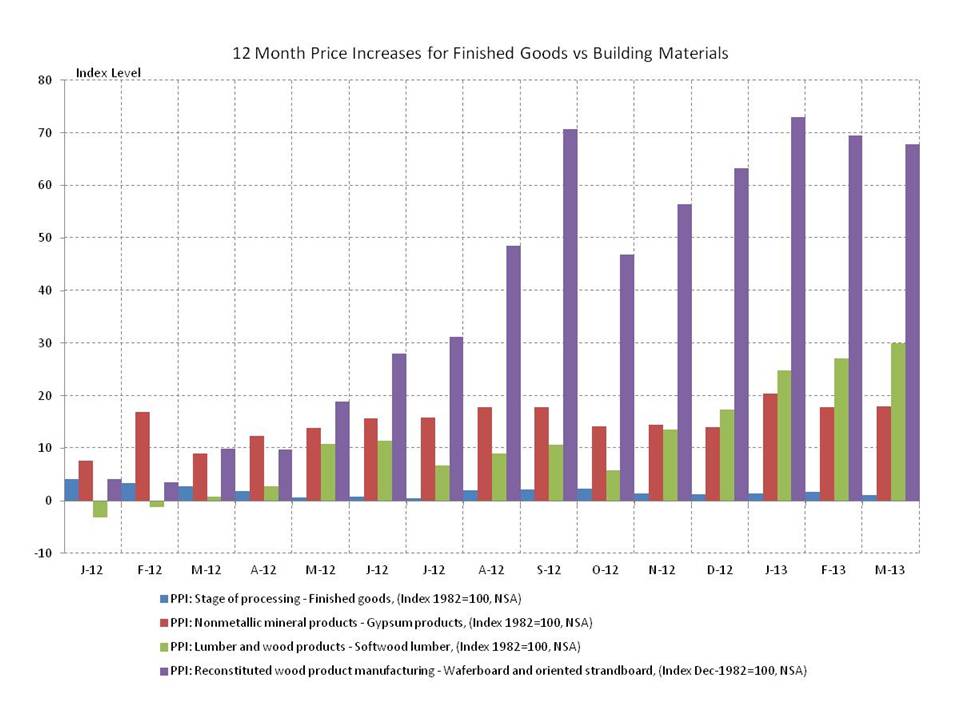
The NAHB has a piece out called Producer Prices in March – Building Materials Prices Approaching Housing Boom Highs talking about how far gypsum (main ingredient in drywall +18%), softwood lumber (2x4s, 2x6s, etc. +30%) and chipboard (oriented strand board and waferboard which have replaced plywood, joists and beams in many applications +68%) prices have risen in the last year, the chart tells the story:
Aaron Task speaking on Yahoo Finance’s Daily Ticker show says that: “Owning apartment buildings and renting them out is a great business.” He’s not as sure about the single family REO to Rentals (RtR) model though. Click the image below to view the video, at about 1:44 in he’s talking about apartment building investment:
Apartment building investment is a great business- Yahoo Finance
The Urban Land Institute’s April Real Estate Business Barometer reports that apartment building investment sales were strong enough to pull the entire sector up from last month’s slump while CRE prices are at four year highs. Condominium sales are also at a 5-1/2 year high with strongly increasing prices.
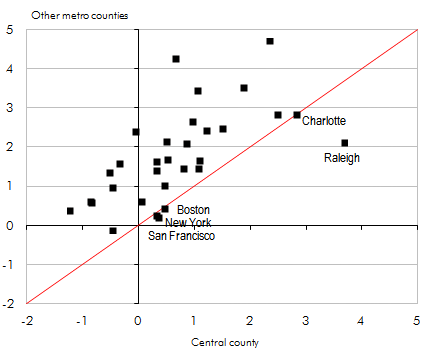
CBRE Econometrics is out with a new report showing population growth trends in major US metros has shifted towards urban centers since 2010 but apartment building investors have been keeping pace (or exceeding it) with new construction. Author Gleb Nechayev, Senior Managing Economist lays it out nicely in a series of charts:
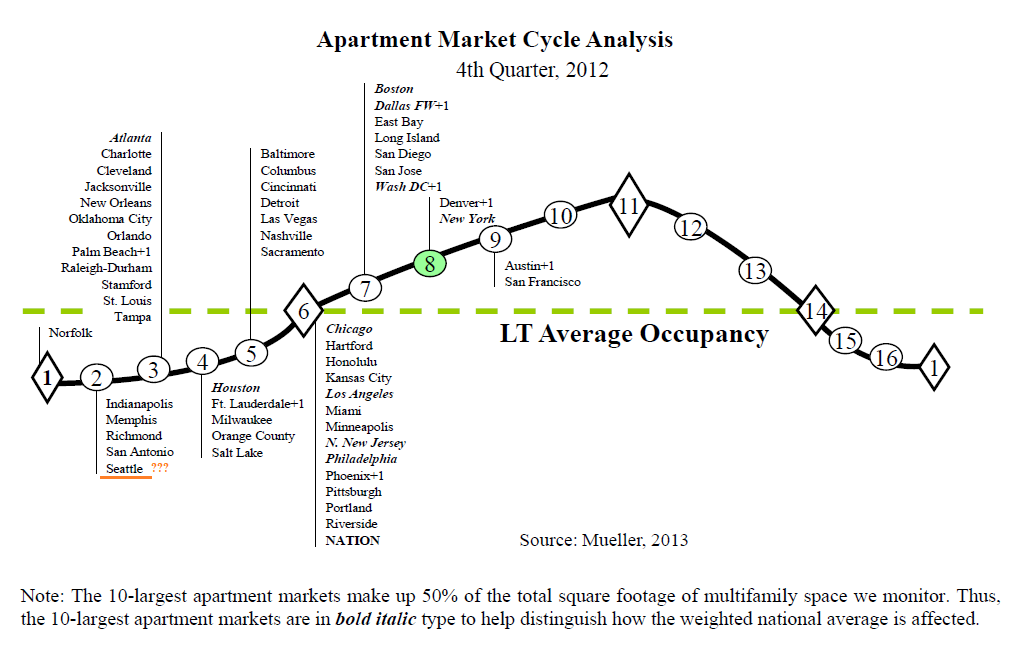
…. “Only six markets advanced their position on the [Dividend Capital Apartment Market] cycle chart.” Once again with the notable exception of Seattle who has left in the basement of the cycle despite overwhelming evidence that it has moved well up in the cycle by his own definition. See my post from last quarter detailing the definitions and why Seattle’s apartment building investment cycle location according to Dr. Mueller is incorrect here. For other cities have a look and let me know if your markets are accurately placed: