Housing recovering from the bottom up- good for apartment builidng investment? 2 charts via Calculated Risk Blog

Bill McBride over at Calculated Risk has a post out this morning with 2 charts of data from LPS on the housing recovery. The first shows that homes in ‘active’ status, either in foreclosure, delinquent or otherwise ‘non-current’ has fallen below 2008 levels for the first time.


Non Current Mortgages below 2008 levels

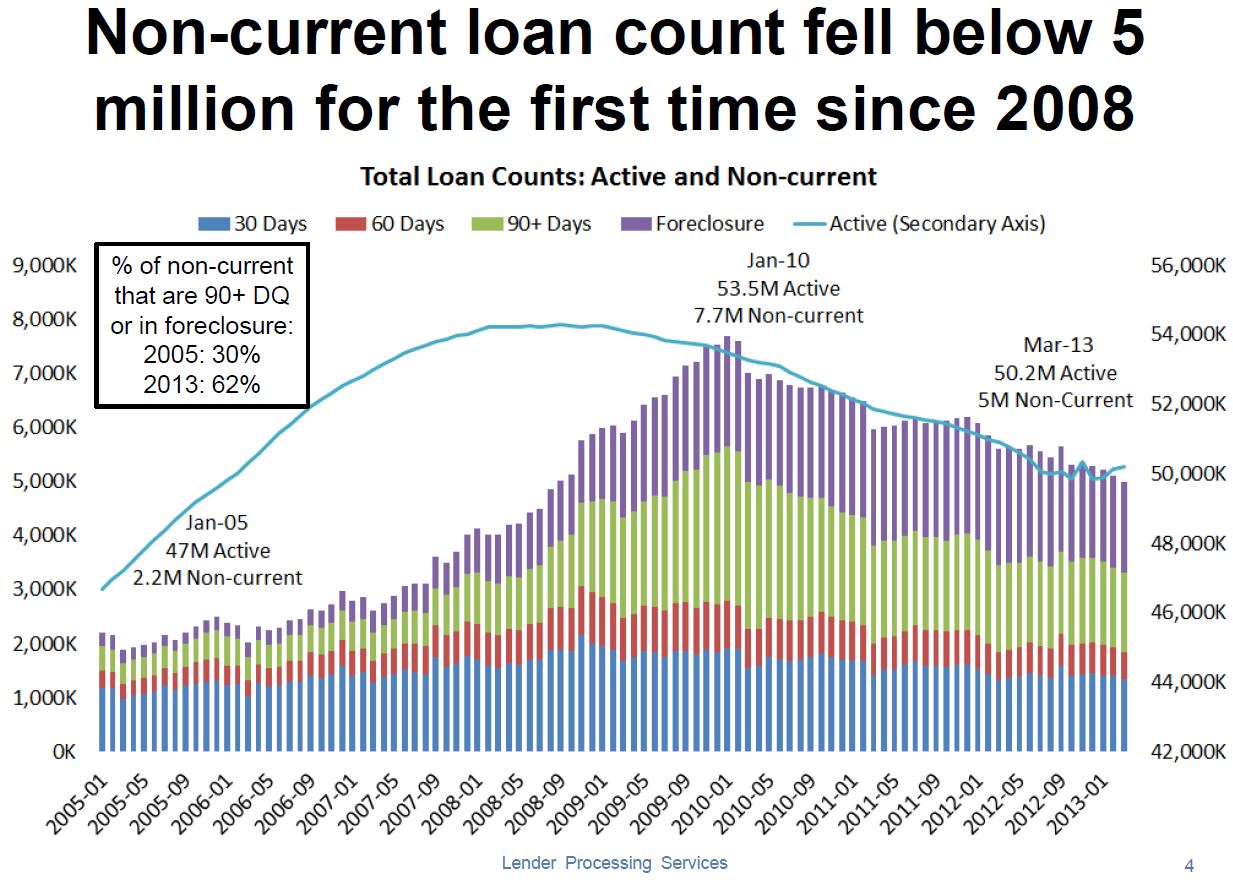
Which is the primary axis and which is the secondary is kind of a mystery and we are left to assume that both are x1,000 so that would imply the left axis is secondary (Or is it?) The most interesting factoid on the chart is in the box on the upper left; The percent of DQ homeowners active (in the foreclosure pipeline instead of being ignored) has doubled. To me this looks like a market that’s starting to clear, which is good for housing and the economy in general.

The next chart looks at the percent of Continue reading Housing recovering from the bottom up- good for apartment builidng investment? 2 charts via Calculated Risk Blog

Local Apartment Building Investment Research Reports For 37 US Cities Now Posted by Marcus & Millichap

Requires (free) registration: M&M Research

Here’s a peek at their Phoenix Charts:

Phoenix Apartment Building Rent Trends Q2 2013

Phoenix Apartment Building Vacancy Q2 2013

Phoenix Apartment Building Construction Q2 2013 Continue reading Local Apartment Building Investment Research Reports For 37 US Cities Now Posted by Marcus & Millichap

Apartment Building Replacement Costs Rising: lumber back to housing boom highs, growing labor shortages.

The NAHB has a piece out called Producer Prices in March – Building Materials Prices Approaching Housing Boom Highs talking about how far gypsum (main ingredient in drywall +18%), softwood lumber (2x4s, 2x6s, etc. +30%) and chipboard (oriented strand board and waferboard which have replaced plywood, joists and beams in many applications +68%) prices have risen in the last year, the chart tells the story:

Apartment Building Material Prices 2012 to Mar 2013
Click on chart for full size image.

Bill McBride over at Calculated Risk has a piece showing the longer term price history for Random Length Lumber (2x4s only, both cash and futures) and a link to a pretty depressing Vancouver Sun article on pine beetle devastation in BC (Spoiler alert: the Continue reading Apartment Building Replacement Costs Rising: lumber back to housing boom highs, growing labor shortages.

Owning apartment buildings “is a great business” :Aaron Task on The Daily Ticker show.

Aaron Task speaking on Yahoo Finance’s Daily Ticker show says that: “Owning apartment buildings and renting them out is a great business.” He’s not as sure about the single family REO to Rentals (RtR) model though. Click the image below to view the video, at about 1:44 in he’s talking about apartment building investment:

Yahoo Finance: Apartment Building Investment is a great business
Apartment building investment is a great business- Yahoo Finance

If clicking the image doesn’t work try this Continue reading Owning apartment buildings “is a great business” :Aaron Task on The Daily Ticker show.

ULI Biz Barometer: Apartment building invesment sales vaulted last month, bouyed otherwise sagging #CRE sector.

The Urban Land Institute’s April Real Estate Business Barometer reports that apartment building investment sales were strong enough to pull the entire sector up from last month’s slump while CRE prices are at four year highs.  Condominium sales are also at a 5-1/2 year high with strongly increasing prices.

Apartment Building Investment and Commercial Property Sales April 2013

“Overall, 65 percent of the key Continue reading ULI Biz Barometer: Apartment building invesment sales vaulted last month, bouyed otherwise sagging #CRE sector.

Charging apartment building residents for water, sewer AND garbage- the growing trend.

In a study by Dupre+Scott they found a growing number of apartment building investors in the Puget Sound region are charging tenants for water, sewer and garbage which make up can make up a pretty large chunk of operating expenses:

apartment expense for tenant water sewer cost

Two-thirds of the properties we surveyed pass through water and sewer charges to residents, and 50% also pass through garbage costs. The average monthly water/sewer charge in the region ranges from $46 for studios to $70 for three-bedroom units. Adding garbage charges increases costs to $55 for studios and $90 for three bedroom units. Our March Apartment Expense Report found that utility charges paid by residents increased 50% between 2008 and 2012.

apartment building utility bills

Do you or have you considered charging for water and sewer via sub-metering, individual metering or a RUBS system? how about garbage? Continue reading Charging apartment building residents for water, sewer AND garbage- the growing trend.

CBRE Research: Since 2010 population shifting towards urban but apartment building construction is outpacing growth in

… A number of major metros

CBRE Econometrics is out with a new report showing population growth trends in major US metros has shifted towards urban centers since 2010 but apartment building investors have been keeping pace (or exceeding it) with new construction.  Author Gleb Nechayev, Senior Managing Economist lays it out nicely in a series of charts:

First Population Growth Average Change 2000- 2010

Population Growth in major Apartment Markets 2000 t0 2010
source: CBRE Econometrics

Raleigh is the only metro with significant urban vs. suburban population growth. Note that one-county metros such as Continue reading CBRE Research: Since 2010 population shifting towards urban but apartment building construction is outpacing growth in

FHFA’s DeMarco re-affirms cutting Fannie and Freddie apartment building loan volume.

As reported by CoStar: “Given that the multifamily market’s reliance on the enterprises has moved to a more normal range, to move forward with the contract goal, we are setting a target of a 10% reduction in multifamily business new acquisitions from 2012 levels,” Edward DeMarco, acting director of the Federal Housing Finance Agency (FHFA) said. “We expect that this reduction will be achieved through some combination of increased pricing, more limited product offerings and tighter overall underwriting standards.”

Fannie and Freddie Apartment Building Loans as percent of multifamily originations
Source: www.multifamilyexecutive.com/

While 10 percent doesn’t sound like much, Fannie Mae and Freddie Mac combined to finance about $62.8 billion in multifamily deals last year, meaning about $6 billion in liquidity will Continue reading FHFA’s DeMarco re-affirms cutting Fannie and Freddie apartment building loan volume.

CoreLogic Map: Almost 23 Million Zombie Homeowners Still Underwater.

CoreLogic is out with their quarterly report and map of underwater homeowners. Their analysis is “showing approximately 200,000 more residential properties returned to a state of positive equity during the fourth quarter of 2012. This brings the total number of properties that moved from negative to positive equity in 2012 to 1.7 million and the number of mortgaged residential properties with equity to 38.1 million. The analysis also shows that 10.4 million, or 21.5 percent of all residential properties with a mortgage, were still in negative equity at the end of the fourth quarter of 2012. This figure is down from 10.6 million* properties, or 22 percent, at the end of the third quarter of 2012.

Negative equity, often referred to as “underwater” or “upside down,” means that borrowers owe more on their mortgages than their homes are worth. Negative equity can occur because of a decline in value, an increase in mortgage debt or a combination of both.

CoreLogic Homeowner Negative Equity Map

Of the 38.1 million residential properties with positive equity, 11.3 million have less than 20 percent equity. Borrowers with less than 20 percent equity Continue reading CoreLogic Map: Almost 23 Million Zombie Homeowners Still Underwater.

New Stats from HUD/Census apartment building finance survey

HUD and the Census Bureau released the latest version of the Rental Housing Finance Survey. The “Survey fills an important gap in our understanding of who owns multifamily rental housing – mostly individuals, not large companies — and how multifamily rental housing is financed, especially as the structure of finance is changing.  In light of recent changes in the availability of capital for rental housing, the Rental Housing Finance Survey also provides important insight about the financial health and stability of multifamily housing properties.” said Erika Poethig, HUD’s Deputy Assistant Secretary for Policy Development.

2012 Rental Housing Finance Survey

This is one table from the xls on the Census Bureau’s site here. Note the tabs on the bottom which have the data broken out by different types.

A few bullet points from HUD’s release linked at the top of the post: