ULI Biz Barometer: Apartment building invesment sales vaulted last month, bouyed otherwise sagging #CRE sector.

The Urban Land Institute’s April Real Estate Business Barometer reports that apartment building investment sales were strong enough to pull the entire sector up from last month’s slump while CRE prices are at four year highs.  Condominium sales are also at a 5-1/2 year high with strongly increasing prices.

Apartment Building Investment and Commercial Property Sales April 2013

“Overall, 65 percent of the key Continue reading ULI Biz Barometer: Apartment building invesment sales vaulted last month, bouyed otherwise sagging #CRE sector.

CoreLogic Map: Almost 23 Million Zombie Homeowners Still Underwater.

CoreLogic is out with their quarterly report and map of underwater homeowners. Their analysis is “showing approximately 200,000 more residential properties returned to a state of positive equity during the fourth quarter of 2012. This brings the total number of properties that moved from negative to positive equity in 2012 to 1.7 million and the number of mortgaged residential properties with equity to 38.1 million. The analysis also shows that 10.4 million, or 21.5 percent of all residential properties with a mortgage, were still in negative equity at the end of the fourth quarter of 2012. This figure is down from 10.6 million* properties, or 22 percent, at the end of the third quarter of 2012.

Negative equity, often referred to as “underwater” or “upside down,” means that borrowers owe more on their mortgages than their homes are worth. Negative equity can occur because of a decline in value, an increase in mortgage debt or a combination of both.

CoreLogic Homeowner Negative Equity Map

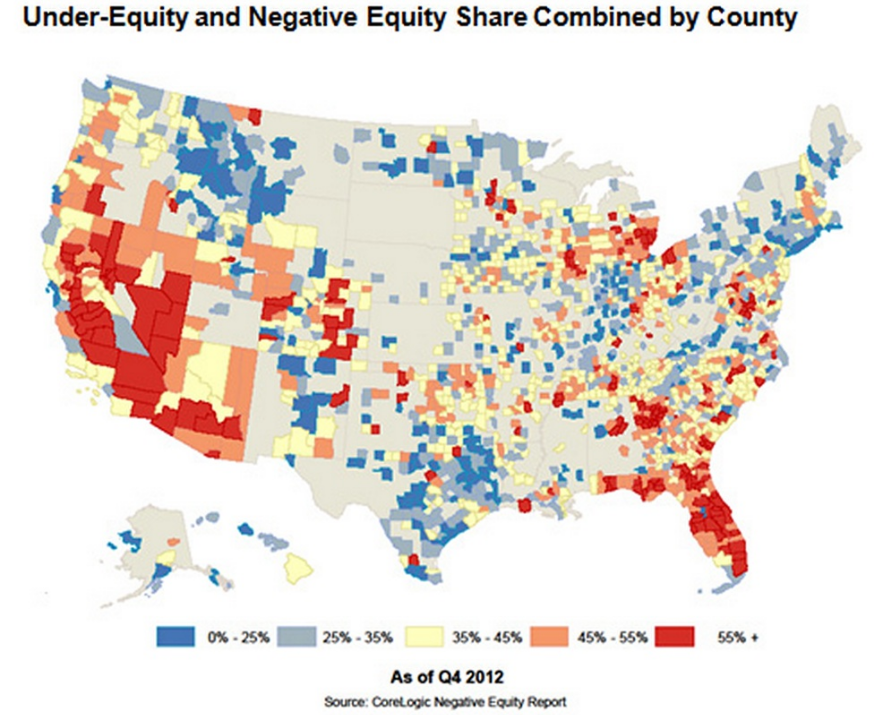
Of the 38.1 million residential properties with positive equity, 11.3 million have less than 20 percent equity. Borrowers with less than 20 percent equity Continue reading CoreLogic Map: Almost 23 Million Zombie Homeowners Still Underwater.

Back To The Future: A Brief History of Apartment Building Design

Mike Scott of Dupre+Scott Apartment Advisors gives a tour through the last hundred years or so of apartment building design. Plus ça change….

In the accompanying article (here) Mike talks with builders and developers about current trends in apartment design and amenities. Interestingly many of these changes provide a competitive advantage to Continue reading Back To The Future: A Brief History of Apartment Building Design

Latest Commercial RE and Apartment Building Investment Cycle Charts Posted by Glenn Mueller PhD.

…. “Only six markets advanced their position on the [Dividend Capital Apartment Market] cycle chart.” Once again with the notable exception of Seattle who has left in the basement of the cycle despite overwhelming evidence that it has moved well up in the cycle by his own definition. See my post from last quarter detailing the definitions and why Seattle’s apartment building investment cycle location according to Dr. Mueller is incorrect here. For other cities have a look and let me know if your markets are accurately placed:

Apartment Building Investmet Cycle Chart Q4 2012

Is it a Seattle thing? Is he the Brent Musburger of commercial real estate? Continue reading Latest Commercial RE and Apartment Building Investment Cycle Charts Posted by Glenn Mueller PhD.

Apartment Building Permits Rise to Long-term Average while Vacancy Index Remains Low

In their latest apartment building permitting report Axiometrics says: “permitting increased 44.3% or 84,308 units from the January 2012 figure of 274,640 units.” This is very near the long term average of 280,000 units, see the chart:

Apartment Building Investment New Construction Permits

Note that single family permits are still Continue reading Apartment Building Permits Rise to Long-term Average while Vacancy Index Remains Low

Apartments 2080: The future of apartments or just channeling the Jetsons? Infographic via MHN Property Management

Multihousing News yesterday posted an infographic called Apartment Living in 2080 suggesting what features might be standard in urban units sixty-seven years in the future. Some cool ideas but there was something familiar about it….

Apartment Building Standard Features in 2080
Click on the image for the full graphic

Oh that’s right, I’ve seen that TV show before!

Jetsons Space Age Apartment

Just one question: When’s my flying car going to get here?

SOMA (Survey of Market Absorption of Apartments) charted by apartment type from the Census Bureau

The NAHB was out with their weekly Eye on Housing report and this week’s edition took a look at the Q3 SOMA data from the Census Bureau. SOMA stands for Survey of Market Absorption of Apartments and overall things are looking pretty positive for developers. One interesting chart they had showed the types of properties that were being built since 2005:

Apartment Building Investment since 2005 by type

Condos and co-op deliveries are Continue reading SOMA (Survey of Market Absorption of Apartments) charted by apartment type from the Census Bureau

Some perspective on New Apartment Building Unit Starts: Census Bureau’s stats charted by the NAHB

The NAHB is out this morning with a chart that gives some perspective on apartment building investment starts. The Census Bureau reported 285,000 unit starts in October for 5+ unit buildings. At that rate it looks like we’re just returning to what was a sustainable level of starts in the ’97-’06 period.

Apartment Building Investment Starts Returning to Sustainable Level
Census Bureau data plotted by the NAHB

While developers tend to overshoot the sustainable level (which is where the apartment building investment cycle comes from) the hope is that Continue reading Some perspective on New Apartment Building Unit Starts: Census Bureau’s stats charted by the NAHB

US Apartment Building Vacancy Below 5%, Rents Growing at Fastest Pace Since ’07.

Apartment Building Vacancies Plunge to 2001 Levels

 Main bullet points from Reis Report’s Q2 Apartment Highlights:

  • National vacancies continue to plunge, ending Q2 at 4.7%.
  • There was a slight moderation in vacancy compression, following 10 quarters of vacancy declines.
  • With such low vacancy levels, landlords have been accelerating rent increases.
  • Effective rents increased 1.3%, the fastest pace since Q3, 2007.
  • Inventory growth remains restrained with just 10,000 units coming online.
  • Developers are starting to build more properties to take advantage of the tight market conditions.

vacancy below five percent for US apartment building investorsHow are vacancy and effective rents trending in your market?

UPDATE: Top 10 US Submarkets for new apartment building units in the pipeline.

In May we posted an article Top 10 US Cities for new apartment building permits where Seattle came in sixth in new apartment building units permitted. Now a new list is out from Axiometrics with a breakdown by submarket and Seattle’s Downtown/Capitol Hill/Queen Anne submarket lands at number two with almost 4,000 units due to come on line in the near future.

Seattle number 2 in Top 10 most new apartment units in the pipeline

And that’s on top of nearly 6,000 units (3,500 in the last two years) that have already been delivered downtown since 2005. Plus there are several other hot neighborhoods such as Belltown and South Lake Union that Continue reading UPDATE: Top 10 US Submarkets for new apartment building units in the pipeline.