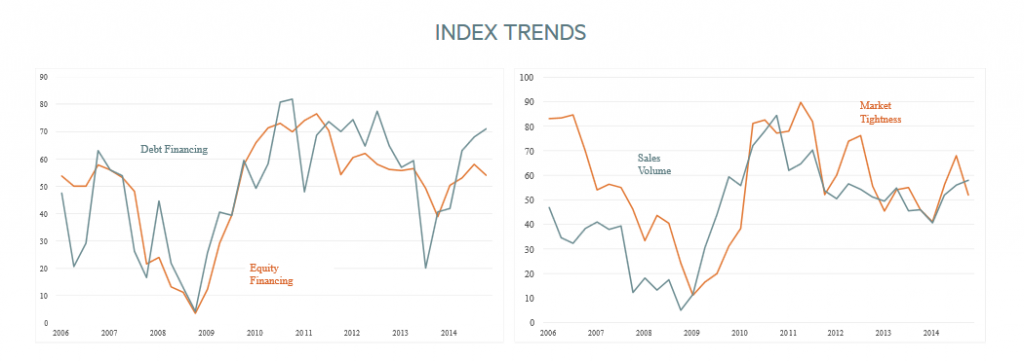
The National Multihousing Council’s (NMHC) latest apartment investment survey out today has market tightness falling to 52 from 68 last quarter. With 50 representing the better vs. worse divide, results show respondents are feeling the bite of new supply plus a bit of seasonal slowdown as well I sense:

While the Sales Volume and Debt Financing measures both improved, Equity Financing also slipped. As you can see from the charts above the results tend to be noisy and I suspect that with the survey format it carries a few behavioral biases as well. You can see that the world was ending according to the Debt Financing a year ago last summer when it plunged to 20 but quickly recovered when the end times turned out to be just a taper tantrum. Of more impact I think is that Equity Financing has been trending down although all four measures have broadly downward sloping trajectories since peaking in 2010-11. Even though the data only goes back to 1999 it looks like these survey responses roughly track the national apartment building investment cycle, what do you think?

Here I’ve charted the average score of the four questions they ask every quarter, the trailing 4 quarter average of those results and the trailing 4 quarter average of their first question about market tightness to see what might be the best indicator. Although it is the noisiest it looks like the 4 question average shows turns before either of the trailing averages which makes sense . More work could be done to see if any of the four questions’ individual results might prove more useful. Any thoughts? I’ll have much more to say on market cycles and reporting on them in upcoming posts.
One other interesting item was the bonus question (#5) about whether respondents were seeing increased leasing by Boomers, forty-somethings, single parents or married couples with children. According to the survey, Boomers and to a lesser extent forty-somethings have been leasing it up over the last twelve months. See the whole NMHC article here. I will be posting much more on the demographic drivers of apartment demand soon.
Good hunting-