Are apartment builders better predictors of the Apartment Building Investment Cycle? Based on the latest cycle at least (a sample of one, admittedly) it appears that they are.
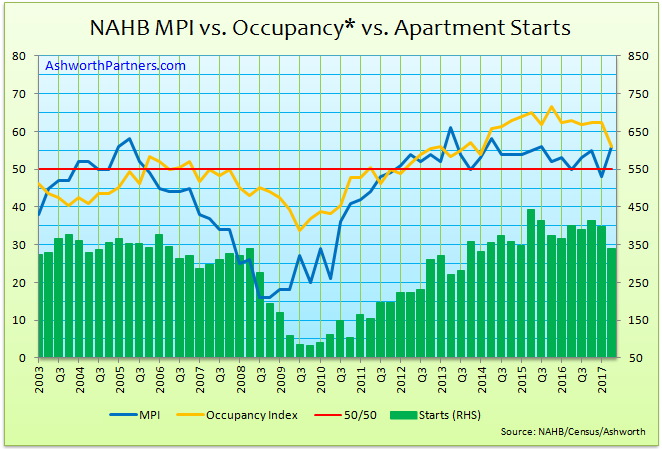
On the chart above the blue line represents the NAHB’s Multifamily Production Index (MPI) which began falling in the 3rd quarter of 2005 and fell for four straight quarters then briefly flattened and ticked up 1 point in Q3 and 4 of 2006 before continuing its descent to 16 in Q3 2008, a total drop from the peak of 42 points. The critical point I believe is when the MPI fell for 4 straight quarters it was an early warning (by up to 2 years) that we were in for a rough ride.
The MPI asks builders whether production of new units is higher, the same or lower than the previous quarter where “any number over 50 indicates more builders report stronger rather than weaker conditions”. In the fourth quarter of 2005 the MPI fell below 50 to 49 in its second of the four consecutive drops, adding conviction to the idea of an impending downturn.
Note that occupancy* represented by the gold line didn’t start falling until it took a 90 basis point** (bp) drop in Q1 of 2008. While the MPI had fallen for its fourth consecutive quarter and third below 50 by Q2 of 2006. Even though occupancy tends to track the cycle pretty well (See: 3 Things I Learned Charting Apartment Market Cycles) having seven quarters of advance notice would save a lot of pain. Occupancy did start trending lower after its peak at 90.5% in Q4 of 2005 but discerning a downturn while the rate danced back and forth across the median may be trying to read the tea leaves too finely.
New apartment unit starts (green columns, right hand scale) didn’t hit the skids until Q3 of 2008 dropping from an annual rate of 341k to 276 and falling for six straight quarters where they bottomed at 82k in Q4 of 2009.
The Takeaway: If the MPI falls four straight quarters and goes below 50 storm clouds are on the horizon.
Good hunting-
*Occupancy on the chart is the inverse of the Census Bureau’s vacancy data on 5+ unit buildings which I indexed so that the median occupancy centers on the 50/50 line of the MPI. The distributions of both occupancy and the index are very normal (median is very close to the average or mean) and the important thing is the direction of change in occupancy and the duration of moves.
**A basis point (bp) is 1/100th of 1% so 100bp = 1.00%; 10bp is 0.10% and so on.
Excellent information as usual. But I’m a bit disappointed in your analysis. You tell us what happened in 2008 but you were unwilling to interpret the trend at the present time. That takes more courage. Based on what your chart shows at the present time, where do you think we’ll be trending going forward? Come on, take a chance.
Thanks Doug, but egging me on is not how to engage my services 😉 What I will say is that there has been a divergence in the national market where some metros seem to have peaked like NYC and San Francisco while others like Seattle continue to be in the expansion phase so a MSA specific view would provide more useful insight. As a result I’d be happy to research any market in the Western US and Canada for you.