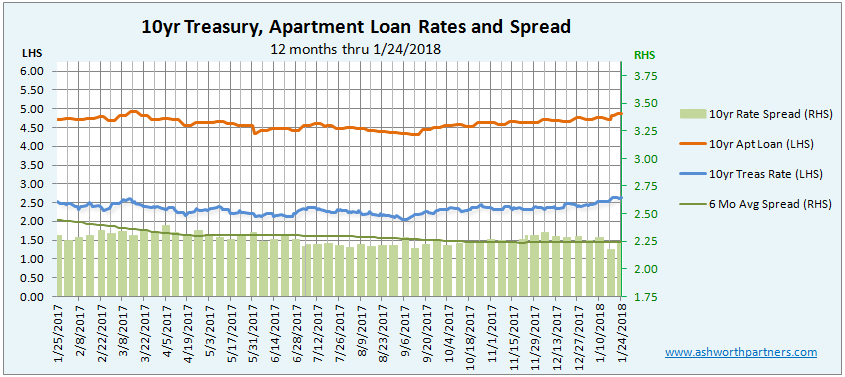
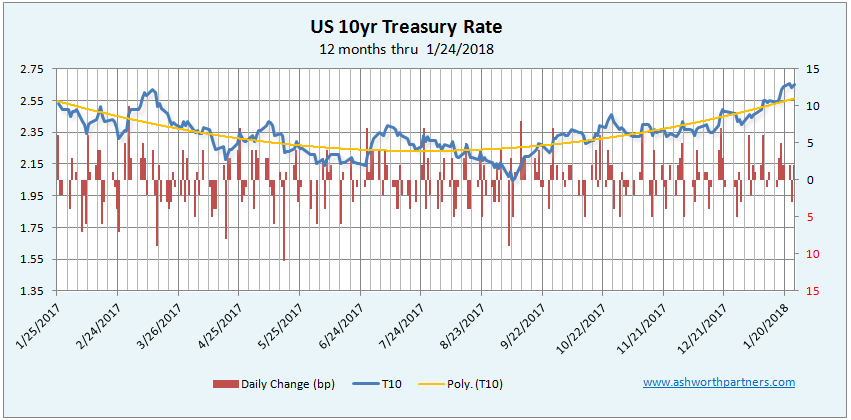
The apartment investment loan rate we track has continued to rise along with the 10yr Treasury (T10), going from 4.76% last month to 4.885% as of yesterday (See below for details on the loans and note that lower rates are available for loans over $5mm). The T10 has gone from 2.46% to 2.65% over the same period with the spread between the two coming in at 2.225, just below the 6 month average of 2.245. As we mentioned back in November, the trend line on the T10 had flipped to an upward sloping curve and that trend is even more pronounced today:
What we’re seeing: With the Fed determined to battle an as yet unseen rise in inflation rates are trending up but baring a geopolitical shock should do so only steadily. The foreseeable danger is that in their haste to ward off this phantom inflation they kill what growth there is in the economy. In the longer term it’s population growth that drives the economy and as immigration is restricted (or under threat) and Millennials continue to delay having kids the economy just isn’t going to grow that fast which will keep a damper on rates.
If you are negotiating a deal right now and you’re weighing financing options it would be worth running a cost analysis on buying a rate lock if one is available. If you would like help with the analysis, or in finding a lender who offers a rate lock we’re just an email away.
Speaking of the spread between the T10 and the apartment building rate we track, the green line on the chart represents the six months trailing average spread. We track changes in the trend for signs apartment lenders becoming more or less competitive. Note that since rates are only quoted on business days the chart averages the last 120 business days which roughly equates to six calendar months.
We track the 10 year Treasury (T10) because it is the benchmark most lenders base their long term rates on. In order to lure investors away from Treasuries to buy mortgage bonds lenders have to offer a premium (AKA ‘spread’) over what can be earned on the ‘risk free’ Treasury. So when the T10 moves, rates on all kinds of longer term loans including on apartments tend to move also. As you can see in the chart, the spread also widens and narrows as market forces make an impact.
Notes about the apartment loan rates shown in the chart above: The rates shown here are from one West Coast regional lender for ‘assumable’ loans on existing apartment buildings between $2.5 – 5.0M. The rate quote they send every Monday that I track is a 30 year amortizing loan with a fixed rate for 10 years (They also have other fixed periods at different rates). The max LTV for this loan is 75% (they have an even lower rate on their max 60LTV loans) and the minimum Debt Cover Ratio (DCR, aka DSR or DSCR) is 120. Note too that these are ‘sticker’ rates, LTVs and DCRs and ‘your millage may vary’ depending on how their underwriting develops. I usually figure that we’ll end up at a 70LTV which also helps the debt cover and provides a larger margin of safety, which is half the battle from a value investing standpoint.
The prepay fee is 5,4,3,2,1% for early repayment in the first five years and you do have the ability to get a 90 day rate lock. The minimum loan is $500k (at a slightly higher rate for less than $1M loans) and they’re pretty good to work with as long as you go in knowing that it takes up to 60 days to close their loan. If you are looking at acquiring an apartment building in California, Arizona, Nevada, Oregon or Washington I’d be happy to recommend you to my guy there for a quote. Send me a message through this link and I’ll make an introduction for you.
Note that the 15 year rate we track is also a 15 year amortizing loan with very similar terms to the 10yr loan.
How the St. Louis Fed calculates the 10 year Treasury rate displayed above: “Treasury Yield Curve Rates. These rates are commonly referred to as “Constant Maturity Treasury” rates, or CMTs. Yields are interpolated by the Treasury from the daily yield curve. This curve, which relates the yield on a security to its time to maturity is based on the closing market bid yields on actively traded Treasury securities in the over-the-counter market. These market yields are calculated from composites of quotations obtained by the Federal Reserve Bank of New York. The yield values are read from the yield curve at fixed maturities, currently 1, 3 and 6 months and 1, 2, 3, 5, 7, 10, 20, and 30 years. This method provides a yield for a 10 year maturity, for example, even if no outstanding security has exactly 10 years remaining to maturity.” For even more detail see: http://www.treasury.gov/resource-center/data-chart-center/interest-rates/Pages/yieldmethod.aspx
As a reminder, one basis point or 1bp is equal to one-one hundredth of one percent or .0001. When you hear ‘fifty basis points’ that’s one-half of one percent; ‘125bp’ would be 1.25% or a percent and a quarter, sometimes referred to as ‘a point and a quarter’. A bp seems like a tiny number, too fine to make a difference but in the debt world if you can squeak out an extra 20bp on a 100 million dollar deal (like a pool of apartment building loans) that’s $200,000.00 in your pocket. To paraphrase Everett Dirksen: 20bp here, 20bp there and pretty soon you’re talking about real money. If you did that every week for a year that would be $10,000,000 and you’d still have two weeks for vacation!