Happy New Year everyone. It’s hard to believe we’re almost half way to another new year (Lunar, on Jan 31st) but these past weeks have been busy here at Ashworth. In addition to working with our apartment building investor clients there have been a number of conferences, webinars, articles and other news reports looking into that murky ball that is the future. Let’s begin with a data dump of the things I’ve been seeing and then we’ll discuss what it all means.
Starting with the bigger picture items, on the Institutional Property Advisors – Marcus & Millichap Research call earlier this week they had a chart showing that house payments are forecast to remain higher on average than apartment rents in 2014:
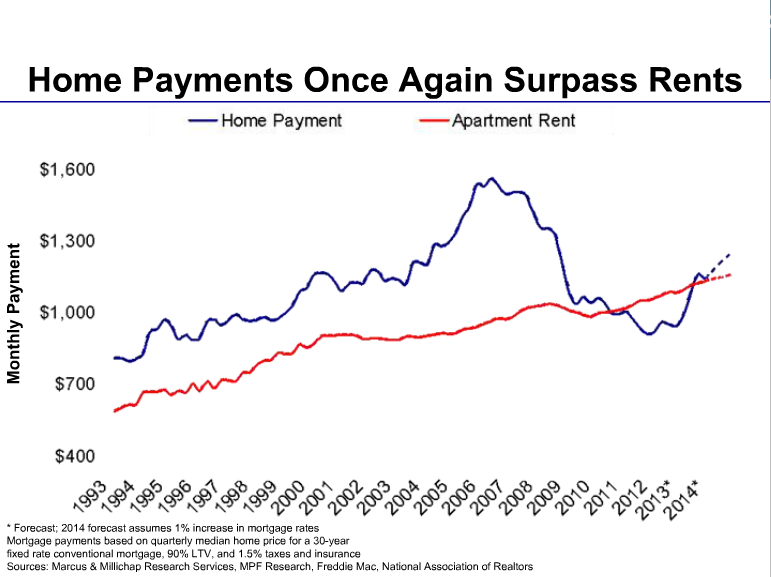
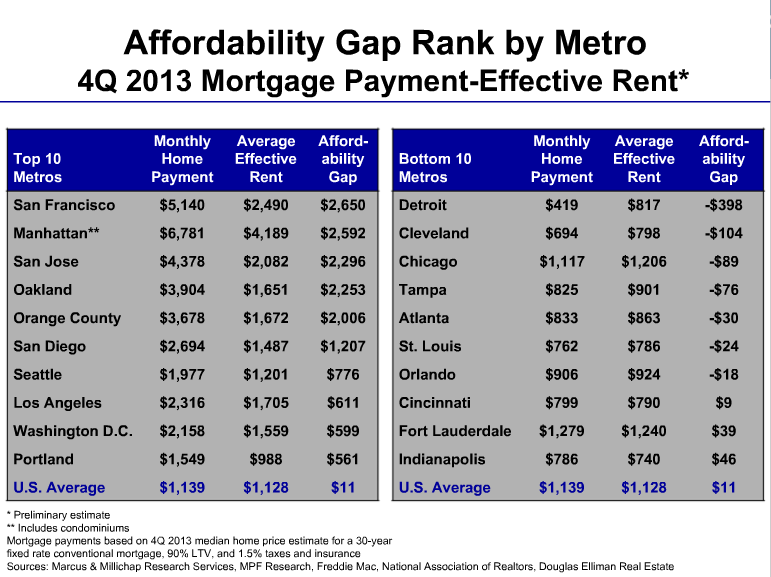
Notice this is just the mortgage payment that’s higher than the rent and doesn’t include all the associated maintenance, repairs and CapEx that’s required to keep a home up (For more on the real cost of homeownership see Rent Vs. Buy And The Great Myth of Homeownership as an ‘Investment’ from Aug. 2012). What that translates into is an “Affordability Gap” where West Coast metros plus DC and Manhattan lead the way with gaps ranging from $561 – 2,650 per month. Meanwhile the US average gap at only $11 a month is pulled down by seven metros with negative gaps; Detroit, Cleveland, Chicago, Tampa, Atlanta, St. Louis and Orlando. Here’s the gap chart from IPA-M&M:
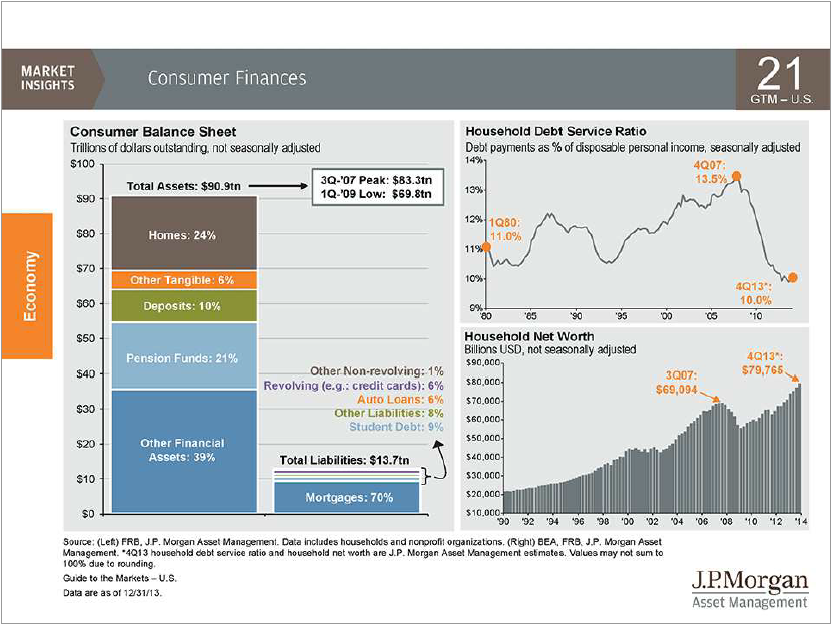
JP Morgan in their latest big book of charts, officially called Guide to the Markets had a nice chart on the state of consumers showing that their finances are improving. Well, except for students whose share of total debt is now 50% higher than either auto loans or credit card debt. The Household Debt Service Ratio is down to 10% and total Household Net Worth at almost $80 billion dollars has surpassed the 2007 peak.
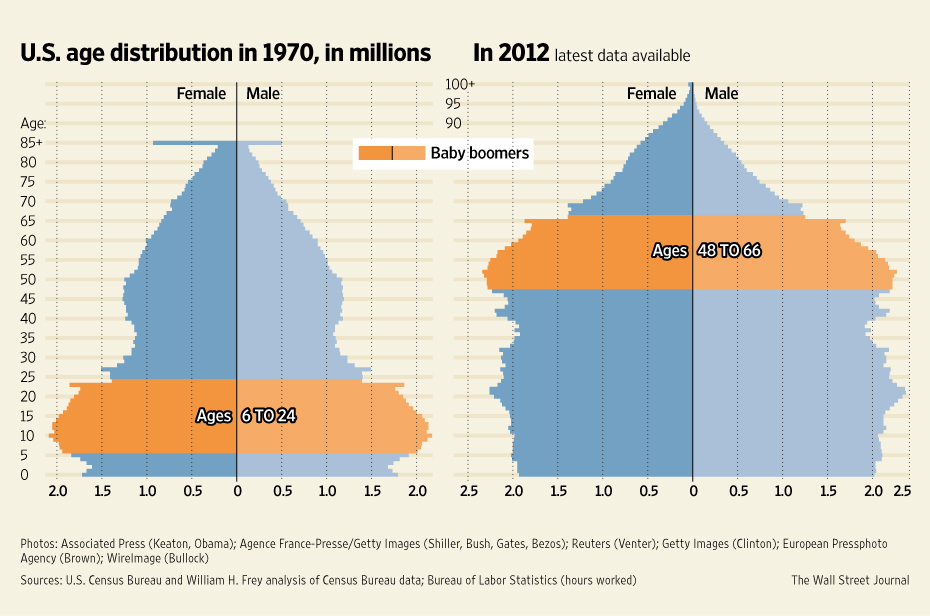
The Wall St. Journal was out with a nice chart of US population by age showing that boomers are still the biggest pig in the python but they’re (ok, we’re) reaching that stage where our numbers will start to ‘taper’. Meanwhile 10,000 will turn 65 every day for the next fifteen years or so.
Moving on to the apartment sector itself, Axiometrics posted their latest apartment permitting report ‘Employment and Permits‘ (about the fourth article down, table-2.) covering their top 40 metros showing both the number of permits and annual job growth:
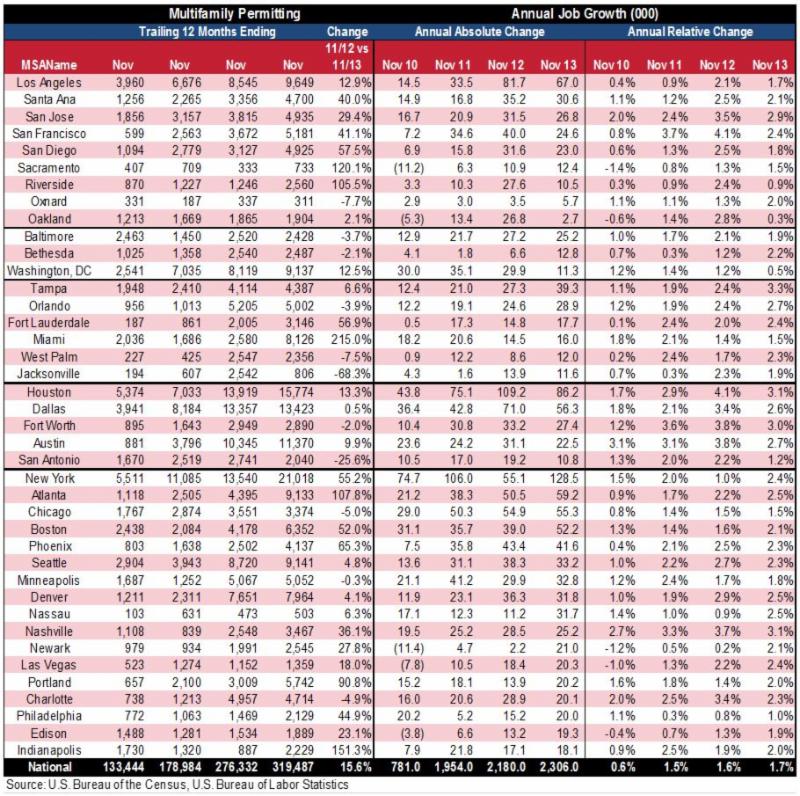
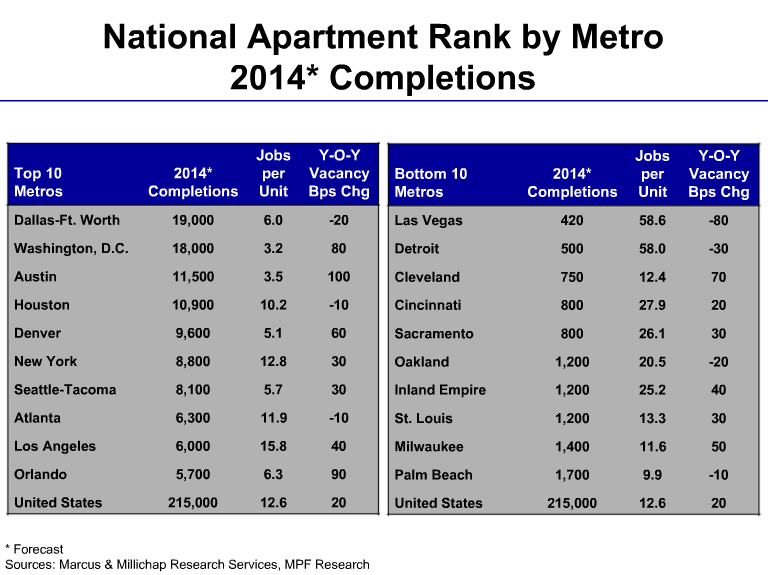
There’s a lot of great data on that chart but as I was heading into the ICA-M&M call that same morning I was thinking: Wouldn’t it be great if they also showed the number of total units in those markets to see what % those new permits are of total supply? Well sure enough M&M Research had a chart for that:
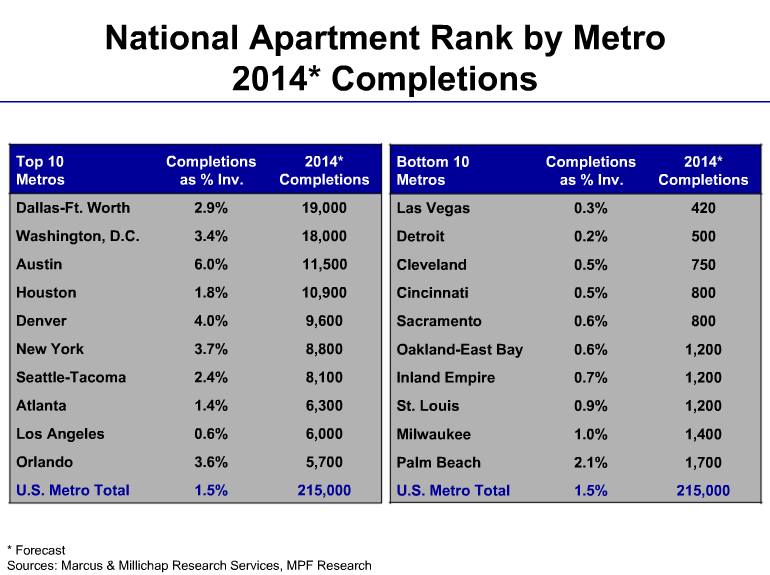
Now the chart only shows forecast units completed for 2014 in the top and bottom 10 metros but we can do a little math on those markets; dividing the number of completions by the completions as a % of inventory to get the size of the market and then match that against the number of completions to get a sense of what’s coming in terms of new supply this year. The first thing to note is that there’s some bad math going with the NYC numbers, or they’re defining that market very narrowly. Dividing the stated 8,800 forecast new units by the 3.7% increase they’ll make in the market says that NYC only has 238k units! In a city of more than eight million people? A quick search brought up the National Multi Housing Council’s Quick Facts Report (a handy source of apartment resident demographics) that showed as of 2011 there were over a million and a half apartments there:
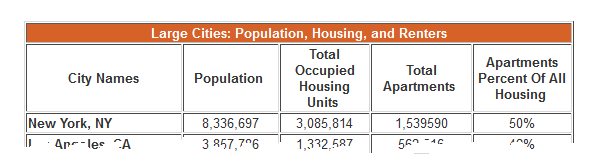
Other reports show a slightly lower count such as this one from nakedapartments.com (over 1.33M units in +5 buildings, also in 2011) using data from NYU’s Furman Center for Real Estate:
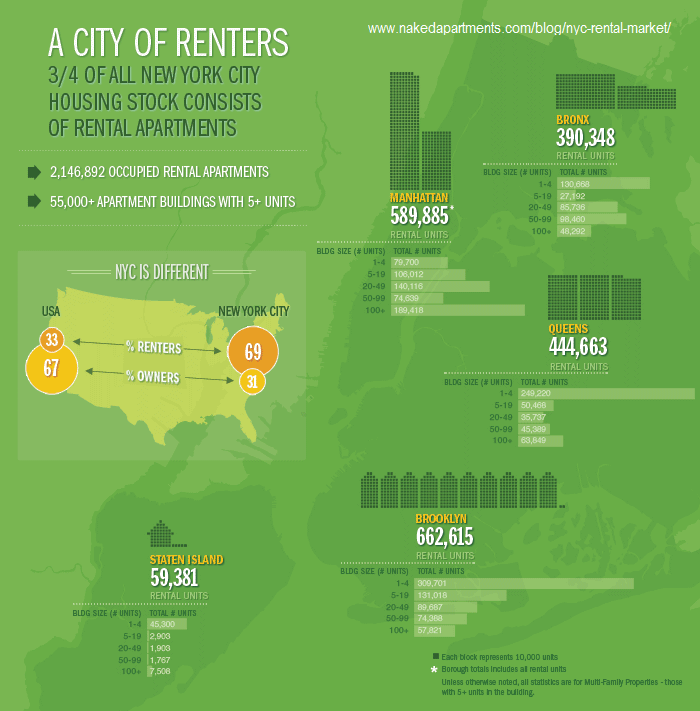
Even if you only count the units in 100+ unit buildings in the five boroughs you get over 330k units.
Back to the new units as a percent of inventory issue, I was shocked that Seattle was way down the list in terms of completions % of inventory at ‘only’ two and a half percent new units but holy concessions Batman, look at Denver with 4% and Austin with 6% new units coming online! This year!
Then I wondered if job growth was going to make absorption a little easier in those markets and sure enough they had a chart for that too:
To put it all together I built a spreadsheet (it’s what I do) to have a look at all these stats together:
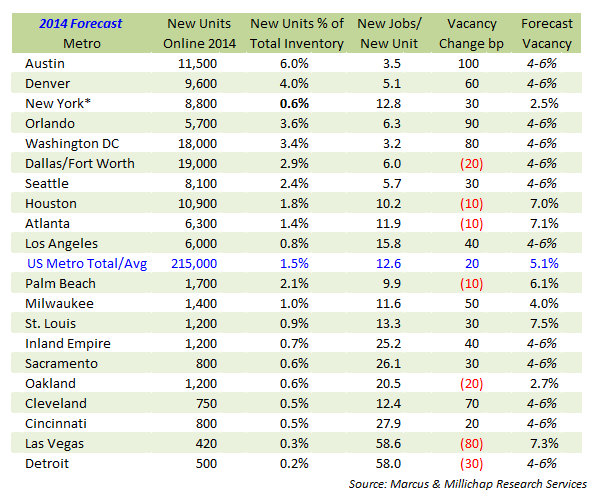
Note that I used the NMHC’s unit count to calculate the impact of new units in NYC. Note also that because not all the metros on the various charts fell into the top or bottom 10 for vacancy their Forecast Vacancy is listed as 4-6% since otherwise they would have made one of the two lists.
On the economic front GDP growth is expected to finally pick up this year; We’ll see. They’ve been predicting that every year for the last five or six so it’s starting to sound like all the leading economists have outsourced their prediction to an underemployed Phoenix weatherman who’s just dialing it in (like people say Alec Guinness did his Star Wars roles). Personally I think we’ll keep plugging along, almost in spite of ourselves. To paraphrase James Carville it’s the psychology stupid. If you’re not a C level Wall St. exec or one of their employees (on the Street or in Congress) my sense is that we’re still recovering from the hit our collective mojo took in the financial collapse.
Individuals are rebuilding their balance sheets, except for students as discussed above, meanwhile corporations are sitting on the biggest piles of cash in history, and some very lofty stock market valuations. There are still a lot of unemployed and underemployed people in this country and I don’t think the economy will really get in gear until corporations start spending and hiring.
Now in the tech and medical sectors (and medical tech?) hiring and spending is going on. For instance in Seattle whenever I’ve started to wonder who’s going to occupy all the new apartments being built there Amazon announces another million sf of offices they’re building or buying. Remember above when we said that 10,000 people a day will be turning 65 for the next decade and a half? Well old people go to the doctor and that means the medical biz is going to be very busy for a while. In the Energy Patch hiring is going on too and not just in North Dakota, but also in the cities where all those companies are headquartered that are working in ND. We think the cities with high concentrations of companies in those sectors are where to be looking for acquisitions.
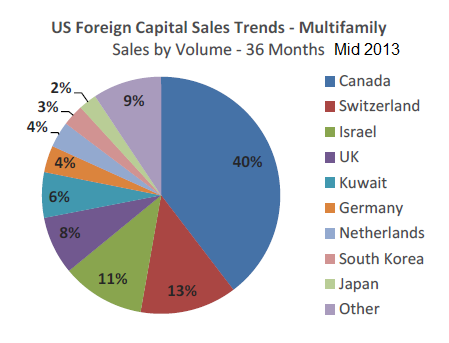
Of course we’re not the only ones who think this and there’s a lot of capital looking for a place to go. A good chunk of that capital is from outside the country and is looking to establish a toehold in the US. Many of these buyer’s cost of capital is very low and they’re very patient. This means that it will be very tough to find value in the coastal, 24/7 gateway markets where a lot of foreign capital is focused.
While I don’t consider them to be foreigners but neighbors, Canadians invest as much money in US multifamily as the next four largest source countries combined According to Collier International’s Mid 2013 Foreign Capital Trends Report
So there is a lot of competition for properties in the most popular markets and the reports we’ve seen indicate that these buyers are starting to look around at smaller markets in search of returns now too. We’re trying to stay ahead of this trend and are looking for niche markets that have favorable employment and household growth but have escaped attention from institutional and foreign buyers so far.
For long term holders we think there is opportunity to acquire good properties in good markets that have already been turned around by short term buyers of distressed properties which were bought in the depths of the downturn. If you’re a long term holder and don’t need to clear a five year IRR hurdle in the mid double digits, 2014 will offer chances to pick up good properties.
Going forward there is due to be more 5-7 year CMBS financed properties whose loans are coming due which could put more supply on the market and present opportunities for acquisition. All in all we think 2014 will be a good year for acquiring properties but it will take more searching and sharper pencils to find good deals.
Good hunting-