In the Analysis on Tapering QE3 post Tuesday I included a chart of the US 10 year Treasury rates and you could see them going vertical in the days since the Fed announcement and Bernanke’s press conference last week. We’re in the middle of negotiations on an apartment acquisition with a client and so what interest rates do over the next few days and weeks is extremely important to us. So here’s the updated chart:
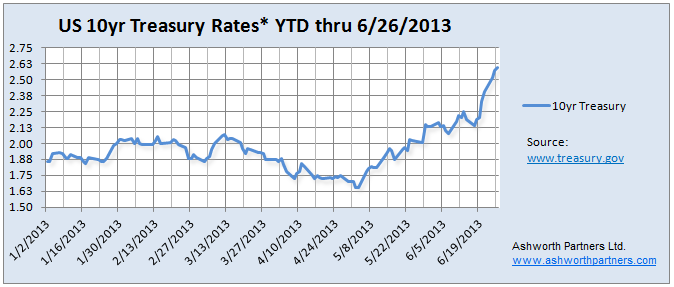
We concentrate on the 10 year Treasury because that is the benchmark most lenders base their long term rates on. In order to lure investors away from Treasuries to buy mortgage bonds lenders have to offer a premium (AKA ‘spread’) over what can be earned on the Treasury. So when the T10 moves, rates on all kinds of longer term loans including on apartments move too. You can see that while the rate typically bounces up and down a bit, in the last week it’s gone up in almost a straight line with no zigs or zags.
As I mentioned in the last post traders apparently took the Chairman’s words to mean that ‘tapering’ was about to start/QE Infinity was ending and the frat party of liquidity was turning into the epic hangover of having to depend on a real economy that may be falling back into recession. Bill McBride makes a very good case that they’re wrong but it’s the traders who have their fingers on the SELL! SELL! button, not reasonable, dispassionate people like Bill.
It turns out that on Monday night before the announcement traders also got a crack like jolt on top of their beery liquidity high when President Obama appeared to be firing Chairman Bernanke live on the Charlie Rose Show. According to reports a number of traders took that as a sign to buy more Treasuries:
But when the Fed minutes were released it was straight into Mortimer and Randolf mode as they decided they had bet the wrong way and now needed to unwind their trades pronto.
Now I don’t give two twits what happens to traders but the fact is they move the market which affects our ability to borrow money at reasonable rates. That is a fundamental problem that comes from letting Wall St. run wild with little (virtually no) effective regulation. We can hope that the market is now ‘oversold’, that prices were driven too low/interest rates too high and will trend back to the recent range soon but who’s to say? As Neils Bohr quoted: “Prediction is very difficult, especially about the future.”
In the mean time if you are active in the CRE or apartment markets either buying or selling I would check in regularly with your lenders to see what rates are doing. If you would like to track the 10 year Treasury yourself I’ll send you the Excel sheet that I built to make the chart at the top. Send us a message with ’10yr Treasury’ in the subject and we’ll reply with the xls and the link to the Treasury data.

I have to agree with you about the lack of clear regulation in the market. It is outrageous how much fluctuation has occurred and how many millions have been made and lost based upon rumors, newscasts, public perception alone.
Travis, very interesting point about the rumors, newscasts and public perception moving markets. I was just reading the Epsilon Theory Manifesto from Ben Hunt http://epsilontheory.com/epsilon-introduction/ where he argues convincingly that in times of social, political and market upheaval that the Common Knowledge which arises from the narratives promulgated by leading investors, politicians, and newscasters can supplant the fundamental values of markets and investments in determining prices. Reading that after a colleague shared Ben’s piece on why gold is doing what it has lately really opened my mind to paying attention to ‘what everyone knows that everyone knows.’
It would be great to hear your take on it.
Well it’s a great news especially that is has been down for many years now. We need a stable and strong Treasury to prove that the current market can cater to businessmen.
Alexis, that’s a very refreshing take on things. How do you see Treasury rates playing out from here and how do they affect your business in Australia?
Three easy ways to keep tabs on the 10yr Treasury are right here on our website:
For the latest quote on the 10yr Treasury rate check the ribbon at the top streaming financial data, the T10 is the first quote that comes by.
For the long term chart back to the 1960’s click on the 10-yr. Treas. rate link in the FRED box at the top of the center column.
For 1 week, 1 month, 1 year and 3 year charts select the 10-year Treasury near the bottom of the Mortgage Rates and Indicators box in the far right column then select the button under the chart for your desired time frame.