Who is buying all those properties and what does it mean for the apartment building investment cycle?

Mark Hickey of CoStar put out a piece looking at who was responsible for the near record $65.8B of apartment building investment in 2012. CoStar’s numbers show that private owners/developers did just about half of all acquisitions last year and institutions were in for 12%, both near their recent trends. REITs on the other hand increased their share by a third, responsible for 12% of sales volume last year.

Interestingly the sellers were pretty much the same groups, except REITs who were the largest net buyers last year.

Apartment Building Investment by REITs 2004 to 2012

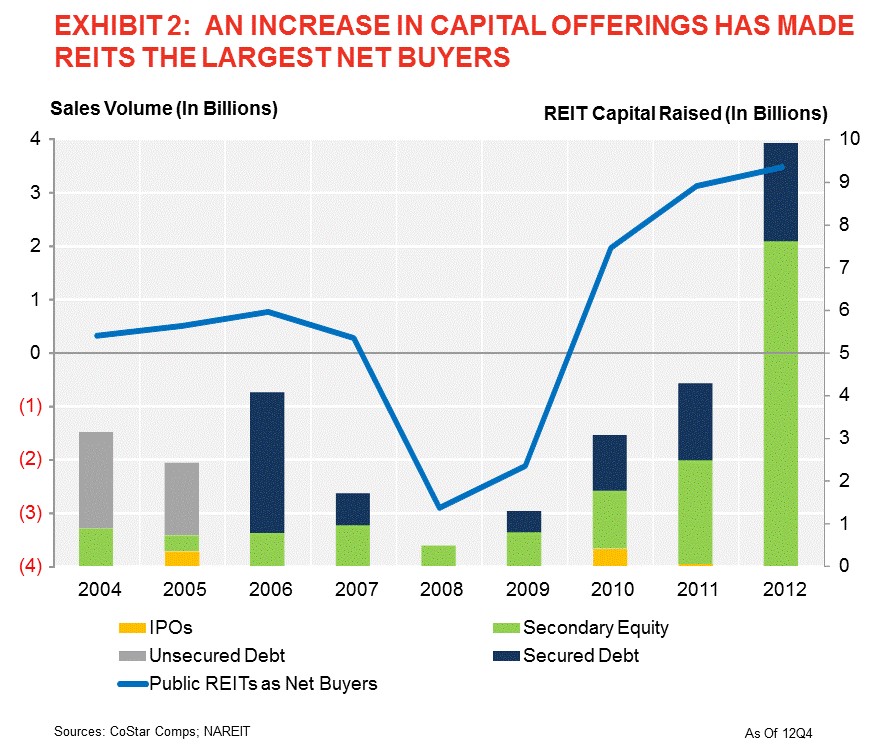
Last year REITs raised 15x the equity they did in 2008 (and 20x the total capital). Up against pockets that deep Continue reading Who is buying all those properties and what does it mean for the apartment building investment cycle?

Housing recovering from the bottom up- good for apartment builidng investment? 2 charts via Calculated Risk Blog

Bill McBride over at Calculated Risk has a post out this morning with 2 charts of data from LPS on the housing recovery. The first shows that homes in ‘active’ status, either in foreclosure, delinquent or otherwise ‘non-current’ has fallen below 2008 levels for the first time.


Non Current Mortgages below 2008 levels

Which is the primary axis and which is the secondary is kind of a mystery and we are left to assume that both are x1,000 so that would imply the left axis is secondary (Or is it?) The most interesting factoid on the chart is in the box on the upper left; The percent of DQ homeowners active (in the foreclosure pipeline instead of being ignored) has doubled. To me this looks like a market that’s starting to clear, which is good for housing and the economy in general.

The next chart looks at the percent of Continue reading Housing recovering from the bottom up- good for apartment builidng investment? 2 charts via Calculated Risk Blog

CBRE Research: Since 2010 population shifting towards urban but apartment building construction is outpacing growth in

… A number of major metros

CBRE Econometrics is out with a new report showing population growth trends in major US metros has shifted towards urban centers since 2010 but apartment building investors have been keeping pace (or exceeding it) with new construction.  Author Gleb Nechayev, Senior Managing Economist lays it out nicely in a series of charts:

First Population Growth Average Change 2000- 2010

Population Growth in major Apartment Markets 2000 t0 2010
source: CBRE Econometrics

Raleigh is the only metro with significant urban vs. suburban population growth. Note that one-county metros such as Continue reading CBRE Research: Since 2010 population shifting towards urban but apartment building construction is outpacing growth in

FHFA’s DeMarco re-affirms cutting Fannie and Freddie apartment building loan volume.

As reported by CoStar: “Given that the multifamily market’s reliance on the enterprises has moved to a more normal range, to move forward with the contract goal, we are setting a target of a 10% reduction in multifamily business new acquisitions from 2012 levels,” Edward DeMarco, acting director of the Federal Housing Finance Agency (FHFA) said. “We expect that this reduction will be achieved through some combination of increased pricing, more limited product offerings and tighter overall underwriting standards.”

Fannie and Freddie Apartment Building Loans as percent of multifamily originations
Source: www.multifamilyexecutive.com/

While 10 percent doesn’t sound like much, Fannie Mae and Freddie Mac combined to finance about $62.8 billion in multifamily deals last year, meaning about $6 billion in liquidity will Continue reading FHFA’s DeMarco re-affirms cutting Fannie and Freddie apartment building loan volume.

The Recession Probability Chart, A New Coincident Indicator?

Quick link to a very interesting chart Bill McBride put up over at Calculated Risk:

Chance of Recession?
Source: FRED. Note: We added the red and green lines (at 80 and 20 on chart) to highlight points made in the article.


The chart is from the St. Louis Fed’s Fred database which I’ve highlighted and you can find the original here.  According to U of O Professor Jeremy Piger: “Historically, three consecutive Continue reading The Recession Probability Chart, A New Coincident Indicator?

Single-Family Rentals Only Marginally Impact Apartment Building Investments PNC EVP says. Video via Globe St.

Scott Bassin, EVP and head of multifamily for PNC Real Estate says single family rentals will only marginally impact apartment building investment because there is a certain group of people who want or need single family homes, and everyone else. See his comments in the Globe St. video from the NMHC Apartment Strategies Conference in Palm Springs.

Single Family Rentals only have small impact on Apartment Building Investment
Scott Bassin, EVP at PNC with Globe St. in Palm Springs


Fannie, Freddie list top Apartment Building lenders for 2012.

Multifamily Housing News has lists of Fannie Mae’s (here) and Freddie Mac’s (here) top lenders and products for 2012. First Fannie’s:

Fannie top Apartment Building Lenders for 2012

And Freddie’s:

Top Sellers Nationwide—Volume

  1. CBRE Capital Markets—$6.2 Billion
  2. Berkadia Commercial Mortgage—$3.6 Billion
  3. Wells Fargo Multifamily Capital; Holliday Fenoglio Fowler, L.P.—$2.4 Billion
  4. Walker & Dunlop, LLC—$2.3 Billion
  5. NorthMarq Capital, LLC—$1.9 Billion

Top Seller by Freddie Mac Multifamily Region

  • Southeast Region: Berkadia Commercial Mortgage, Richmond, Va.
  • Central Region: CBRE Capital Markets, Dallas, Texas
  • Western Region: CBRE Capital Markets, Newport Beach, Calif.
  • Northeast Region: Beech Street Capital, LLC, New York, N.Y.

Fannie grew their small loan volume by Continue reading Fannie, Freddie list top Apartment Building lenders for 2012.

Compare all mortgage rate indexes back to 1990 and beyond. Handy website and tool.

One of my clients who does distressed debt pools shared this link to a site that has mortgage rate index history and a tool to compare them. Very handy for deciding on an index or between competing mortgages. Also helpful research if you’re planning to sue over the LIBOR rate rigging scandal.

mortgage x dot com database

Continue reading Compare all mortgage rate indexes back to 1990 and beyond. Handy website and tool.

MBA: GSEs vital in Ensuring Liquidity and Stability in apartment building investment finance.

The Mortgage Bankers Association is out today with a white paper “Ensuring Liquidity And Stability: The Future Of Multifamily Housing Finance And The Government-Sponsored Enterprises“. (or see the MHN exec sum here) The paper highlights the role of the GSEs (Government Sponsored Enterprises, i.e. FNMA ‘Fannie Mae’ and FHLMC ‘Freddie Mac’) in today’s multifamily finance market and presents five recommendations for the future making their points with a set of charts that demonstrate the size of their role in multifamily as well as the very low amount of bad loans they’ve made in the sector.

  • Our nation’s housing policies should reflect the importance of multifamily rental housing, the range of capital sources that support this market, and the need for liquidity and stability in all market cycles.

Apartment occupancy has been growing while single family has been falling

GSE lending has been the largest part of meeting multifamily financing needs Continue reading MBA: GSEs vital in Ensuring Liquidity and Stability in apartment building investment finance.

My Challenge to Zillow on repair and maintenance costs in their rent vs. buy comparison.

The Fiscal Times had a piece the other day reviving the good old rent vs. buy meme. The new angle was that Zillow has updated its method for comparing the costs of renting and the costs of buying and uses it to produce what it calls a ‘Breakeven Horizon.’  Besides sounding vaguely like the title of an old sci-fi movie, beyond the breakeven horizon is where buying a home makes more sense than renting and in theory the less time to the horizon, the more the market is tilted towards buying.

Now I have to admit I was intrigued with the thought that Zillow had re-examined their methodology because as I have written about earlier, their previous calculation ignored the real costs of maintenance, repairs and saving up for replacing big expensive things like the roof, the furnace and the driveway and that is a pretty big chunk of money over time. Industry figures for repairs and maintenance on single family housing run from one to three percent of the home value.  Have a look at the chart* below to see how much a relatively modest 1.5% adds up to over time.

The Myth of Home Ownership as an Investment Debunked
Click for full screen chart view.


Surely I thought, Zillow had been convinced Continue reading My Challenge to Zillow on repair and maintenance costs in their rent vs. buy comparison.