In many top US markets the supply of office space has not just been stagnant, it’s actually been shrinking and apartment building investors have been the beneficiaries.
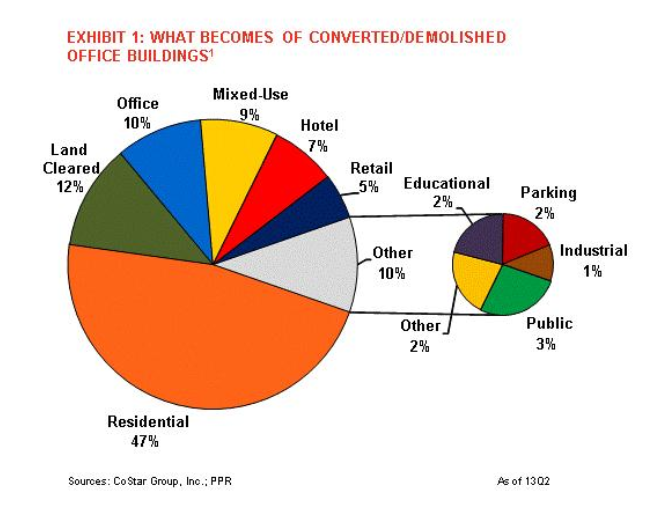
In a CoStar piece out today entitled Didn’t That Used to Be an Office Building? they list a couple big advantages of converting office space to apartments: Office working residents are close to work, and there’s great access to public transportation. How many people who spend hours a day sitting on the freeway would like the option to park the car all week?
If you combine the residential and mixed use portions of the chart below, 56% of the office conversions/demolitions are going to apartments:
The rate on the 10yr fixed (30yr amortization) apartment building loan we track stayed in the 5.0-5.1% range for the second week while the spread to the 10yr Treasury remained in the 240 area, still lower than the 2013 average of 264:
Tom Barrack was on CNBC last week to talk about real estate with the traders. Great TB quote to open the show: “It’s always great to be the slowest guy on Fast Money”. There’s more wisdom in that statement than any of the show’s regulars understood.
A couple bullet points but definitely worth watching the video. The link on the image below goes to the Colony website where they edited the three segments together (commercial free too):
Housing [of all types] is the best opportunity. Today there might be a Fed bubble but there isn’t a housing bubble.
The rise in interest rates while not big and still low historically speaking, will hit entry level housing. 100bp (basis point, where 100bp = 1%) rise in interest rates will cost a borrower an extra $150+/- a month on their mortgage payment for a $200,000 home. That will keep more people renting.
Click on the image to go to the Colony website video (no commercials)
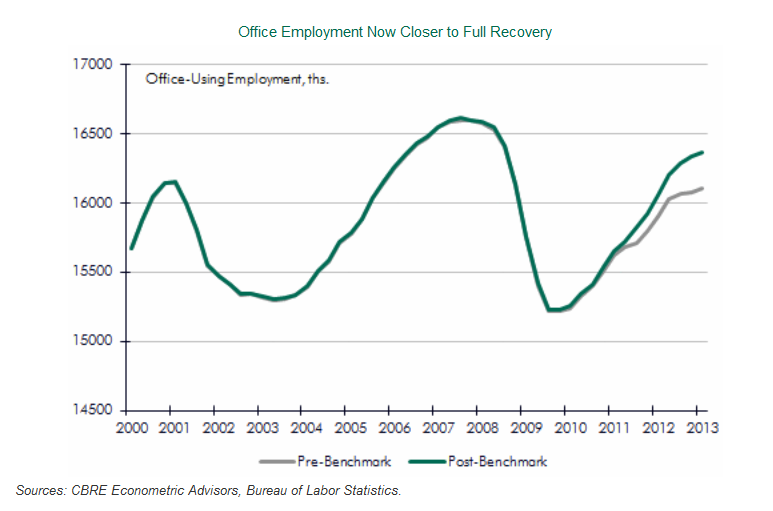
Interesting report from CBRE Econometric Advisors on the revised employment numbers just out from the Bureau of Labor Statistics’ (BLS). The BLS updates their employment numbers every year to reduce the error rate from their regular surveys and the revisions were up:
Click for full size image.
It is important to understand that the employment data produced by the BLS are based on a survey and therefore are subject to sampling error. As part of its survey methodology, the BLS completes a re-benchmarking of its payroll employment data annually, to account for any job gains or losses that were missed over the course of the past year. The payroll survey consists of a sample of 145,000 businesses and government agencies covering 557,000 worksites throughout the U.S. The BLS uses a birth-death model to account for changes not directly reported in its sample due to business openings and closings.
In order to adjust for missing information that could cause the birth-death model to miss its mark, the BLS annually benches its estimates to unemployment compensation records, to allow for a reconciliation of total payroll employment. Although the largest changes are always seen in the most recent year or two, estimates as far back as five years may be measurably altered, which can have a significant effect on how the labor market is seen to have affected commercial real estate demand. The process is first done at the national level, and then at the state and local levels.
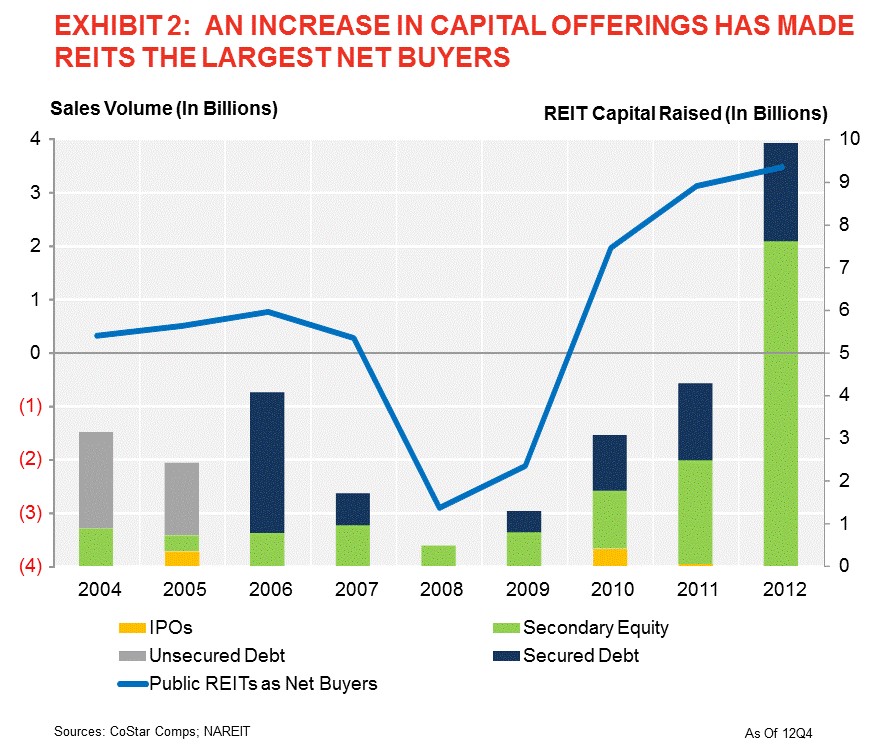
Mark Hickey of CoStar put out a piece looking at who was responsible for the near record $65.8B of apartment building investment in 2012. CoStar’s numbers show that private owners/developers did just about half of all acquisitions last year and institutions were in for 12%, both near their recent trends. REITs on the other hand increased their share by a third, responsible for 12% of sales volume last year.
Interestingly the sellers were pretty much the same groups, except REITs who were the largest net buyers last year.
The Urban Land Institute’s April Real Estate Business Barometer reports that apartment building investment sales were strong enough to pull the entire sector up from last month’s slump while CRE prices are at four year highs. Condominium sales are also at a 5-1/2 year high with strongly increasing prices.
Biggerpockets began publishing their top 35 List of Real Estate Blogs in 2006 and the list has generated over 100,000 views. Only ten of the original honorees still remain on the list, a statement to the hard work involved in building and maintaining a good blog and surviving tough times in the market.
At Ashworth Partners we’ll keep doing what we can to make sure the valuable time you spend here is well invested. We don’t have all the answers though so if you have a suggestion or comment about how to improve the blog we appreciate your feedback.
Dividend Capital’s Q3 Market Cycle Monitor Report is out and naturally I looked at the apartment building investment cycle chart first. Specifically these days I’m looking to see where the author, Glenn R. Mueller Ph.D. has placed the Seattle market in the cycle.
In this latest report you can see that it is listed at position 2 with only Norfolk listed lower at position 1. What does position 2 signify? According to the good Doctor, position 2 lies in the Phase 1 – Recovery Quadrant defined as having “No New Construction” and position 2 specifically having “Negative Rental Growth”. But how can this be? Continue reading Apartment Building Investment Cycle Analysis via Dividend Capital. Can this be right?
Tom Barrack of Colony Capital on what’s really happening in US real estate from an investor’s perspective. The clearest, most cogent look at the state of commercial, multifamily and single family markets today and where the opportunities are. The first five and a half minutes is about Europe and the bottom line there is don’t but after that it is all gold. If Tom wanted to be one of those real estate ‘gurus’ he could package this video with a big notebook and some advertising and sell it for $10,000- and it would be better than any of the other stuff out there. And you get it for free. I’ve watched three times and get an extra little nugget each time.